| GISdevelopment.net ---> AARS ---> ACRS 2000 ---> Image Processing |
Flooded Area Assessment with
Fused Multi-Spectral Multi-Sensor by using Texture Feature Analysis and
Neural Network Classification
Kobchai DEJHAN, Sompong WISETPHANICHKIJ, Prasit KERDYOU, Fusak CHEEVASUVIT, Somsak MITATHA, Chanchai PIENVIJARNPONG*, Chatcharin SOONYEEKAN**
Faculty of Engineering and Research Center for Communication and Information Technology,
King Mongkut's Institute of Technology Ladkrabang, Ladkrabang, Bangkok 10520, Thailand.
Tel : 66-2-3269967, 66-2-3269081, Fax : 66-2-3269086
e-mail:kobchai@telelan.telecom.kmitl.ac.th
* National Research Council of Thailand,
MOS-I Receiving Ground Station, Ladkrabang, Bangkok 10520, Thailand.
** Aeronautical Radio of Thailand,
102 Ngamduplee, Tungmahamek, Bangkok 10120, Thailand.
Keywords: flood, multi-spectral, multi-sensor, texture feature, neural network
Abstract
In recent tens year, there have exist significant natural environment changes, especially in a country covered by monsoon climate as a tropical area. The environmental management, planning and monitoring must be done to avoid a recurrent disaster. Multi-temporal images are used to detect the environment changing, while the multi-spectral images provide necessary information for land cover interpretation. To conveniently assess the flooded area, radar images act as the flood monitoring due to the properties of all weathers, day-and-night and capability of cloud-piercing. Therefore, multi-sensors of such images are merged to hold each superior characteristics by using image fusion technique, as shown in this paper. The classification and interpretation for flooded area identification of fused images based on the texture analysis and neural network classification. These comprehensive method shows the efficient investigation and assessment the unupdated area.
1. Introduction
There are several efforts to monitor and assess flood area. Especially, the monsoon regions are suddenly inundated by flash flood caused by the storm and others natural hazard. Several techniques have been applied to estimate the flood area. To investigate and identify the damage areas.
The radar image uses the back-scattering wave technique in the antenna direction gives two evidence results, discontinuity/roughness of the object surface and the object absorption depending on the moisture. Therefore, SAR images are efficiently flood detection. However, the classification and interpretation of SAR image are quite difficult with low precision because its mechanism is quite different from multi-spectral image. Texture feature analysis in section 2 shows comprehensive methodology to describe such data.
As the multi-spectral images provide necessary information for land cover interpretation. The fusion details of an effective exploiting the complimentary nature of these different data types, especially the SAR- optical image have the clearly different characteristics. Therefore, the dominant data addition of multi-spectral image into SAR image will make the data analysis to be comfortable and easy.
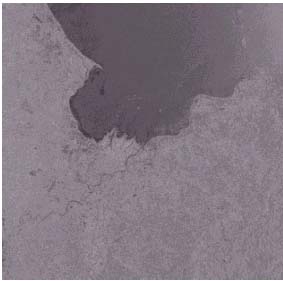
Figure 1 JERS-1 SAR image acquired on June 03,1997, Surat Thani province.
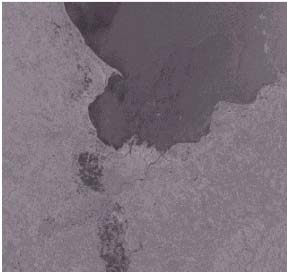
Figure 2 JERS-1 SAR image acquired on August 30,1997.
This paper have been adopted this technique to perform the flood area classification. The mixed data of SAR and OPS (optical sensor) obtained from JERS-1 satellite in the flood period of central area of Thailand as study region. This region is water hole with flooding. JERS-1 SAR data acquired on June 03, 1997 and August 30, 1997 were taken before and during flood hazard from the tropical storm Zita, in Surat Thani province, were used. Because of its cloud penetration capability as shown in Fig.1 and 2, respectively. Fusion these images with JERS-1 OPS data acquired on March 14, 1997 were performed to distinguish flood area. Using the wavelet decomposition based on low wavelet coefficient of SAR image is included with OPS image, the wave absorption from the object moisture is combined with the other pysical data as mention in section 3.
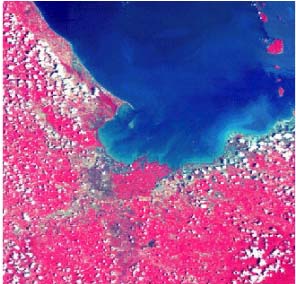
Figure 3 JERS-1 OPS data acquired on March 14,1997.
To study the flood assessment, the image classification is used as a revolutionary computing methodology known as the multi-layer perception (MLP) neural network based on the back propagation (BP) algorithm suitably for multi-spectral image as shown in section 4. The fused image and texture content are applied to this mechanism. Thus, the classification and analysis of flood area will be high resolution and high accuracy. The results and conclusion are presented in last section.
2. Texture Content
The textural information is assumed to be contained in the overall, or average, spatial relationship among gray levels for a particular image. Although no formal definition of texture exists, intuitively this descriptor provides the measures of properties, such as smoothness, coarseness and regularity. The three-principle approaches use to describe the texture context are statistical, structural and spectral. The statistical approaches use to be descriptor of spatial relationships and yield characterizations of textures as smooth, coarse, grainy, and so on. This
spatial relation is considered to be the covariance of pixel values as a function of distance and direction between pixels. Such information can be extracted from an image using gray-tone spatial-dependence matrices or co-occurrence matrices (Wisetphanichkij, 1999). Let Z be a random variable denoting discrete image intensity, P be a position operator and let A be a k*k matrix whose element aij is the number of times that points with gray level zi occur (in the position specified by P, relative to points with gray level zj, with 1 =i, j =k. The co-occurrence matrix (A) can be constructed as follow;
1. The numbers of different pixel values (zi) are determined.
2. These pixel values are ranked (k) smallest to largest.
3. The digital image is scanned in the direction noted (P-operator) to determine the frequency with which one of these pixel values follows another.
4. Each entry in matrix (A) is divided by n, the number of pixels in the image satisfying P, let this resultant matrix be called co-occurrence matrix (C).
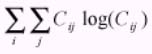
To analyze a co-occurrence matrix (C) in order to categorize the texture, the statistical parameters as a set of descriptors are computed as follows.
1. Maximum probability
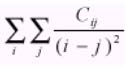
2. Second-order inverse element difference moment.
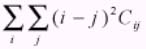

The image fusion can be divided into two classes: spatial domain method and spectral domain method. The last method is used in most application, such as color space transformation. In this paper, the IHS (Intensity-Hue-Saturation) model will be used as a color space and the image fusion is done as follow:
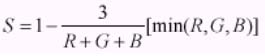
1. The RGB color space of OPS image is transformed to the IHS model [3]:
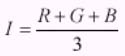
Equation - 6
Equation - 7
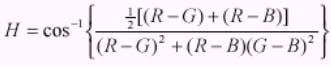
Equation - 8
2. The different gray value of pixel in the black-white of two SAR images (g1 and g2) are added into the OPS image intensity:
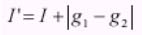
Equation - 9
The last term of the above equation is the different of before and during flood. The flood area will be emphasized and non-flood area will be depressed. Adding this term to intensity component in IHS mode means transferring of flood area data to OPS image.
3. The IHS model is inversely transformed to the RGB space and ready to classify in the further.
4. Neural Network Classification
In this paper, the multi-layer perceptron (MLP) neural network based on back propagation (BP) algorithm is used as classifier, which consists of set of nodes arranged in multiple layers with connection only between node in adjacent layer by weights. The input informations are presented at input layer as the input vector. The output vector is the processed information, that are retrieved at the output layer. The hidden layers stand between these two-layers. A schematic of a three-layer MLP model is shown in Fig 4 and used in this paper.
In this work the nonlinear function, Sigmoid function given in Eq.(12), is used to determine the output state:
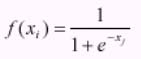
Equation 12
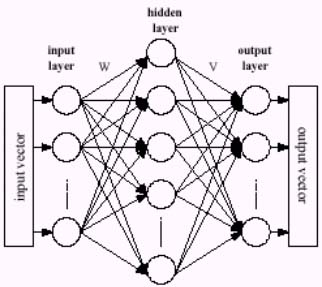
Figure 4 The 3 - layer (MLP) model of neural network.
5. Methodology And Results.
5.1 Method
Pre-processing/image preparation
- The SAR data obtains 16 bit and are reduced to 8 bits in order to obtain 256 values of intensity by using linear scaling.
- From wavelet decomposition [5], the low wavelet coefficient of SAR images will be used within two reasons, to remove the speckle noise and continue the proper data for applying to neural network training algorithm.
- The 12.5m x 12.5m resolution of SAR data were reduced to 25m x 25m in the same order of OPS resolution. All image should be registered and geometric corrected.
- Follow the instructions as in section 2 with P-operator "one pixel to the right and one pixel below", co-occurrence matrix can be constructed.
- Using statistical parameters, only second-order element difference moment and entropy as a set of descriptors to reduce input node of MLP neural network and save calculation time. The first descriptor represents the value of the variogram at a lag distance as a P-position operator that is applied to develop the co-occurrence matrix. The second descriptor is a measure of randomness, achieving its highest value while all elements of co-occurrence matrix are equal.
- Data fusion technique as mentioned in section 3, is used as shown in Fig.5.
- After pre-processing satellite image prepares then applying to neural network
- classification. Two kind of texture content will be added in to two last input nodes of network to increase classification accuracy.
| Classifi- cation |
Water | Cloud | Urban | Vegetation | Bare Soil | |||
| Flood | Non-Flood | Flood | Non-Flood | Flood | Non-Flood | |||
| Result/ testing (pixel) |
478/500 | 47/50 | 45/50 | 43/50 | 44/50 | 90/100 | 44/50 | 89/100 |
| Corre- ction |
95.6 | 94.0 | 90.0 | 86.0 | 88.0 | 90.0 | 88.0 | 89.0 |
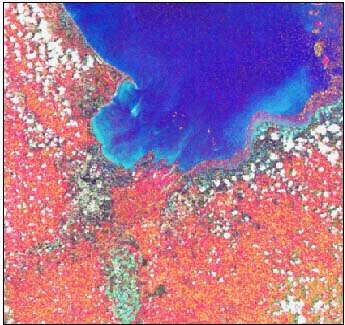
Figure 5 Fused image for flood area assessment.
As results, above method show effectiveness and efficiency of multi-temporal SAR data, whichare very useful for flood assessment and monitoring. The SAR texture content helps us to identify a flood area. While as the OPS data provide the necessary information for land cover interpretation with the highly reliable result.
Acknowledgement
The ground truth informations are kindly supported by Office of Agricultural Economics, Ministry of Agriculture, Royal Thai Government.
References
- Xiaomei, Y., and Chenghu, Z., 1998. Recognition of Flooded Area in Radar Image Using
- Texture Feature Analysis. Proc. of 19 th Asian Conference on Remote Sensing (ACRS'98), Manila, Philipines, pp. P22-1 - P22-6.
- Carr, J. R., 1998. The Semivariogram in Comparison to the Co-Occurrence Matrix for
- Classification of Image Texture. IEEE Trans. Geoscience and Remote Sensing, Vol.36, No.6, pp.1945-1952.
- Wisetphanichkij, S., Dejhan, K., Cheevasuvit, F., Mitatha, S., Arungsrisangchai, I., Yimman, S., Pienvijarnpong, C., Soonyeekan, C. and Chanwutitum, J., 1999. A fusion approach of multispectral with SAR image for flood area analysis. Proc.of the 20 th Asian Conference on Remote Sensing (ACRS'99), Hong Kong, China, pp.53-58.
- Wisetphanichkij, S., Dejhan, K., Cheevasuvit, F., Mitatha, S., Netbut, C., Pienvijarnpong, C., Soonyeekan, C. and Chanwutitum, J., 1999. Multi-temporal cloud removing based on image fusion with additive wavelet decomposition Proc. of the 20th Asian Conference on Remote Sensing (ACRS'99), Hong Kong, China, pp.1109-1114.