| GISdevelopment.net ---> AARS ---> ACRS 2000 ---> Image Processing |
Feature Extraction In
Residential Areas By Knowledge Modelling
Hsi-min Chao
e-mail:hmchao@seed.net.tw
John C. Trinder
University of New South Wales
e-mail:j.trinder@unsw.edu.au
Hsi-min Chao
e-mail:hmchao@seed.net.tw
John C. Trinder
University of New South Wales
e-mail:j.trinder@unsw.edu.au
Keywords: Digital Photogrammetry, Feature Extraction, Knowledge Modelling, Image Understanding
Abstract
The study describes the procedure of digital image processing, and interpretation approaches to the sample image for object recognition. A classified section on an aerial image obtained by texture analysis is input as a potential residential area for further interpretation. Both linear (1D) and regional (2D) features are extracted from the classified section, based on image segmentation in terms of the degree to which their statistical, geometrical, and physical properties matched to rooftops and roads that mostly appeared in residential areas.
Linear features are detected first using Canny's method. The derived edge map is then defined for straight lines and vector information, such as line equation and intersection angle by the Hough Transform. Areal features are extracted and numbered through thresholding and coding techniques,based on relevantfactors, such as physical surfaces, size and scale, and housing density. These potential house blobs can also be located by computing the centroid thus providing vector information.
Rooftop extraction rate is studied by comparison of ground truth and roof blob number. An improved thresholding extracts 60% rooftops in the study. Knowledge required for the identification of rooftops and roads are discussed.
Representating and modelling for residential areas are based oncharacteristics of houses and streets, for example, roof chains and road intersections. Syntactic patterns that form the relations between identified features needs to be further studied. An early model of housing area is proposed and tested whether they fit the extracted features and relations between features for the purpose of image understanding.
Introduction
This research on digital photogrammetry studies some functions in computer vision technology and their performance when applied to photogrammetric mapping. It is based on Marr's vision theory of the primal sketch and image representation, with consideration to both physical (brightness) and psychological (human vision) factors in digital image analysis. The objectives are thus to develop the procedures and techniques that will support the processes of feature extraction and recognition of cartographic features in digital aerial images.
The process of segmentation partitions an input image into its constituent parts. The output of the segmentation stage usually consists of pixels constituting either the boundary of a region or all the points in the region itself. In either case, converting the raster data into a mathematical form suitable for computer processing is necessary. Three types of segmentation methods, histogram, discontinuity, and similarity, are used in practice.
Object representation is an essential process for transforming raw image data into a suitable geometric form for subsequent computer processing. Most cartographic features are usually identifiable in aerial photographs by a human interpreter. The geometric representation of objects in terms of their extracted linear and regional features can provide information for computer based description of the image contents.
The term "representation" in this study has two broad usages: one is to present different image processing stages for the mathematical description of objects, as indicated in [Marr 1982] and [Ballard and Brown 1982]; the other is to describe programmed human knowledge i.e. knowledge representation.
Marr [1982] stated that although human vision delivers a shape description of an object from one image, it is almost certainly impossible to do this in only one step, which leads to the idea of a sequence of representations, starting with descriptions that could be obtained straight from an image, but actually are carefully designed to gradually facilitate the subsequent recovery of an object's physical characteristics and mathematical properties about its shape, size etc.
Three vision representational stages are introduced by Marr [1982]:
1. 2D representation or primal sketch --- the representation of the properties of a two-dimensional image, such as intensity changes and local two-dimensional geometry.
2. 2.5D representation --- the representation of the properties of visible surfaces in a viewer-centred coordinate system, such as the surface orientation, distance from the viewer, and discontinuities in these quantities; the surface reflectances; and some coarse descriptions of the prevailing illumination.
3. 3D representation --- an object-centred representation of the 3D structure and of the organisation of the viewed shape, together with some description of its surface properties.
The role of knowledge is displayed in Figure 1, showing four basic representational categories in computer vision.
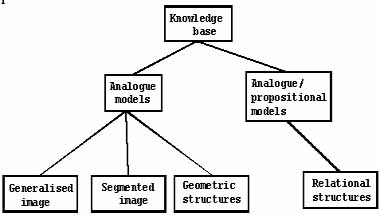
Figure 1 The knowledge base of a complex computer vision system, showing the four basic representational categories. [Ballard and Brown 1982]
The significant topics included in pre-processing for this sudy are, the creation and comparison of multi-resolution images, and texture description and modelling, for residential areas. The image understanding system in the study provides a data structure for images used in different stages for specific projects. Texture measures derived by the co-occurrence matrix have resulted in a suitable method of classification on multi-resolution images [Chao and Trinder 1997]. Linear and areal features, such as rooftops and straight roads are extracted respectively for the purposes of segmentation, representation, and recognition.
Feature Extraction
'Features', as described in Sowmya and Trinder [2000], can have different meanings in photogrammetry and computer vision. In this paper , 'features' refer to lines, road crossings, corners, blobs, regions. The extraction procedure involves both linear (road boundaries) and regional (roof blobs) features. Roof groups form the main part of the process, but houses are not the only elements in residential areas. Important co-existing linear features, most probably straight roads, must also be considered.
Edge Detection of Road Boundaries
The Hough Transform (HT) is used to extract straight lines from an edge segmented image (or edge map). The edge map of a residential area is still very complex, so it is difficult to recognise a road network without knowing the location and number of roads. The advantage of using HT is that no prior knowledge of line position is needed. It works even for imperfect edge maps [Hough 1962]. HT pre-processing is carried out using a Canny edge detector.[Canny 1986] It has been shown by Chao and Trinder [1997] that low resolution images simplified the information content, both physically and geometrically, but fail to represent some details. Therefore, high resolution images were chosen for road detection.
Grey level edges reflect the steepness of the intensity changes. To enhance the linear elements on the extracted edge map, an appropriate threshold was selected by the human operator, to ensure the best contrast and quality of linear features. The input image to the HT is the edge map derived from the edge detection process. The output image presents all the detected linear elements in binary mode. The actual straight lines identified by this method which is based on low levelknowledge are presented in Figure 3 [Chao 1999].
Roof Group Extraction
Rooftop extraction is based on image intensities. House density studies by Forster and Jones [1988] and Ng [1990] have been applied to determine a suitable threshold for the extraction of roof blobs and to assess the number of houses in an area. According to Forster and Jones [1988], rooftops reflect approximately 15% of the visible light, but are not necessarily with high intensity. This means that approximately 15% of pixels in a black and white image of a residential area will be related to buildings. Three rates in close arithmetic sequence5%, 8%, 12% , were used to test the extraction of an appropriate number of roof topbright blobs, .
Output images from these 3 P-tile thresholds based on extraction rates of 5%, 8%, 12% , are then combined by adding the new images together. This shows that the number of roof blobs in the new image is more than is obtained in any of the three independent images. Hence the total number of roof blobs can be increased and the rooftop extraction rate improved. This is because some blobs that appeared in the 5% extraction rate image did not necessarily appear in the other extracted images. Table 1 shows that the accuracy of the rooftop extraction rate can be increased from 27 percent to 42 percent, up to 60 percent, when the extraction percentage is increased. However, this also increases the number of erroneous blobs, as indicated in Table 1. Therefore, shape representation techniques, (e.g. elongatedness and compactness,) are needed for accurate rooftop extraction and recognition. Results for accepted regions are demonstrated in Figure 3. Better accuracy of extraction is expected to be achieved when higher percentages are used.
Building shape representation is a major issue in 3D building reconstruction and visualisation processes. For precise single building reconstruction, a scale larger than 1/8,000 is required. However, a scale of 1/8,000 might provide a better display of the surrounds and associated information, such as the house density, and the housing patterns in a typical residential area.
| House density percentage | Extracted blobs | Extracted correct blobs | Extracted but error | Accumulated correct blobs (accuracy) |
| 5% | 19 | 19 | 0 | 19 (27%) |
| 8% | 30 | 28 | 2 | 30 (42%) |
| 12% | 47 | 38 | 9 | 42 (60%) |
Table 1 Results of rooftop extraction based on 3 different extraction levels.The total house number of ground truth is counted to 70.
Semantic Information of Major Residential Objects
Knowledge representation and modelling have been important topics in object recognition. For the contextual study of residential areas, some related factors are considered as follows:
1. Co-existence relates possible objects in a specific class. In this study objects such as houses, roads, trees, grasslands , all appear in a typical residential area.
2. Adjacency, derived from the region adjacency graph in Sonka et al. [1993], is expressed by the distance between individual objects, but it can also be explained by geometric relationships such as, neighbour of, next to, part of, contains, above, below, inside, outside, vertical, horizontal, parallel to, etc. as suggested in Guelch et al. [1990].
3. A Relational structure is based on semantic knowledge in terms of is_a, a_kind_of. It therefore, provides a meaning or a physical object for matching a symbol to an object.
Semantic Knowledge Supporting Image Processing
This section concerns the verification of the previous relational structure, a hypothetical model for the analysis of a residential sub-image. A flowchart, presenting different levels of dependence and independence in the context of the sub-image is shown in Figure 2. This is a proposed early image understanding procedure, that includes four basic parts:
1. Image processing for pre-processing, data structure, and segmentation.
2. Unary independent context (or low level context) for representation.
3. Unary dependent context (or middle level context) for representation, and classification.
4. Binary dependent context (or high level context) for recognition, and image understanding.
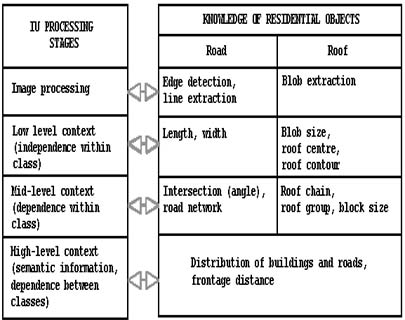
Figure 2 A proposed IU system utilising both context and knowledge for residential areas recognition at different stages and with corresponding results.
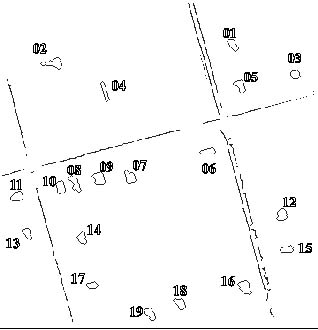
Figure 3 Results of a test of the co-existence and adjacency of two residential objects, housing and road boundaries. The merging of housing and road patterns results in a reasonable distribution and contextual view of a typical residential area. This binary image is a result of 5% value for house reflectance and line detection. The original image scale = 1/8,000, with a resolution = 1m/pixel, image size (x:y) = 386 x 374 pixels, from Wellington, NSW.
To understand residential areas, both roofs and roads are extracted and partly identified by their descriptors. The use of road and roof maps for context considerations can lead to better identification of the objects in the residential cell. The IU system in Figure 2 shows how different levels of contextual information are processed in the study. The extracted features and recognised objects in a residential model derived from the proposed IU system is shown in Figure 3.
Concluding Remarks
A quality "primal sketch" is important for giving both global and local information image understanding. A global primal sketch (texture) provides grouping for classification purposes, while a local primal sketch (edge and line detection) provides correctly selected objects for recognition and an object-based contextual network.
The rate of house reflectance in images of residential areas for visible light is between 13% to 15%. The procedure in this study commenced with a rooftop extraction rated of 5% and varied to a rate of 12%. An intermediate rate is also recommended for extra blob information. However, for the use of only one rate, 5% is suggested, as there is a minimum of error in the extraction process, as shown in Table 1.
Low level forms of knowledge (descriptors or features), and domain knowledge (binary contextual relation) are designed for recognition methods, and have proven to be both logical and feasible. The paper has proposed a semantic network for determining residential patterns support as a photogrammetric IU system, which has been tested successfully on one example. a .
This example of residential area recognition by knowledge representation techniques based on semantic networks shows that domain knowledge is necessary to address the adjacency, co-existence, and relational structures between different objects and classes.
Acknowledgements
This research is mainly financially supported by Chung-Cheng Institute of Technology, Taiwan, Republic of China.
References
- Ballard, D.H., Brown, C.M. 1982. Computer Vision, Prentice-Hall INC.
- Chao, H., Trinder, J. 1997. Texture Parameter Analysis on Residential Area, 1st Trans Tasman Surveyors Conference Technical Papers, pp. 23-1/23-9, Newcastle, NSW
- Chao, H. 1999. Road Boundary Segmentation and Representation of Residential Areas in Digital Aerial Imagery, The 18th Symposium on Science and Technology of Surveying and Mapping, pp.807/813, I-Lan, Taiwan
- Canny, J.F. 1986. A Computational Approach to Edge Detection, PAMI Vol.8, No.4, pp. 679/698
- Forster, B.C., Jones, C. 1988. Urban Density Monitoring Using High Resolution Spaceborne Systems, IAPRS, Comm VII, Vol.27, pp. 189/195
- Guelch, E, Axelsson P, Stokes J, 1990. Object Description and Precise Localisation of Prescribed Objects in Digital Images. IAPRS Vol.28, part 3, pp. 221/233, ISPRS Com. III Symposium, Wuhan
- Hough, P.V.C. 1962. A Method and Means for Recognizing Complex Patterns, U.S. Patent 3,069,654
- Marr, D. 1982. Vision, W.H. Freeman and Company
- Ng, T.K. 1990. Predicting Residential Housing Density and Housing Size with Satellite Imagery Using Simplified Models, Research Project Report, Master of Engineering Science, University of New South Wales, Sydney, Australia
- Sonka, M., Hlavac, V., Boyle, R. 1993. Image Processing, Analysis and Machine Vision, Chapman and Hall Computing
- Sowmya, A., Trinder, J. 2000. Modelling and Representation Issues in Automated Feature Extraction from Aerial and Satellite Images, ISPRS Journal of Photogrammetry and Remote Sensing 55(2000) pp.34/47