| GISdevelopment.net ---> AARS ---> ACRS 2000 ---> Image Processing |
Image Analysis of Remote
Sensing Data Integrating Spectral and Spatial Features of Objects
Joji IISAKA and Takako SAKURAI-AMANO*
Pacific Forestry Centre, Natural Resources Canada
506 West Burnside Road, Victoria, BC. V8Y 2N3
E-mail :http://www.gisdevelopment.net/aars/acrs/2000/ts9/jiisaka@pfc.forestry.ca
*The Earth Observation Research Centre/NASDA
Roppongi First Building, 13F
1-9-9 Roppongi, Minato-Ku, Tokyo 106-0032 Japan
E-mail:http://www.gisdevelopment.net/aars/acrs/2000/ts9/takako@eorc.nasda.go.jp
Keywords: TM images analysis, object
recognition, spatial information extraction, application of fractal
dimension, pixel swapping, image analysis of remote sensing
Abstract
Digital image analysis techniques have been and are being used widely in remote sensing assuming that each terrain surface category is characterised with spectral signature observed by remote sensors.
Even with the remote sensing images of medium coarse resolution such as Landsat TM data, integration of spatial information is expected to assist and to improve the image analysis of remote sensing data.
This paper will describe and demonstrate a method, named as" Pixel swapping", to analyse remote sensing images in a unified way, integrating spatial information extraction as well as spectral information.
After a brief introduction of the method, some application to identify terrain objects like roads in the forest are demonstrated utilising the spatial information of objects.
1. Introduction
With remote sensing images such as LANDSAT TM data, most of digital analyses are applied through pixel-by pixel basis, assuming that each ground cover objects has their specific spectral characteristics.
The conventional digital image processing techniques, based on the field theoretic approach, have many advantages in numeric and analytical calculation such as filtering the signals and classifying terrain covers using multi-spectral characteristics of objects, but they are not so capable to handle spatial and geometrical information.(J. Richard, 1994, J. Jensen, 1995).
On the other hand, the mathematical morphology, based on a set theoretical approach, provides better capability with morphological processing of objects, but week in numeric and quantitative treatment of objects. Thus, more powerful functions to handle spatial feature extraction for remote sensing are required.
2. Spatial Information Extraction For Remote Sensing
As an extension of conventional image processing and mathematical morphology, It has been proposed a method to process spatial information in an image.(J.Iisaka,1989, 1998, 1999, 2000, and J. Iisaka, et al, 1993 and 1994)
2.1 Image Computing through Pixel Swapping.
An image is defined as a function image intensity field I with parameters of a coordinate pair, x and y as:
I= f (x, y) (2.1)
For a digital image, the set of co-ordinate value, X, is a finite set, and the function (2.1) is a projection of a set X to an element of a pixel value set, a, and can be denoted as:
I= {(x,a(x):x eX)} (2.2)
Here, a is a set of the pixel values
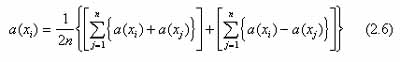
This equation can be rewritten again using two points, dividing it into two terms as
a(xi)=[{a(xi)+a(xj)}/2
+{a(xi)-a(xj)}/2] (2.3)
This means that an image is composed with two components,
one represents an additive term between a pixel at the co-ordinate and
another pixel at the co-ordinate and the other represents a subtractive
term between them.
Let's demote the first term as
I+={(x,{a(xi)+a(xj)}/2:x eX)} and the second term
as
I-={(x,{a(xi)-a(xj)}/2:x eX)} (2.4)
Then, an image, I, is presented as
I=I ++I-
(2.5)
The selection of a pixel pair between pixel i and j is arbitrary. A homogenous flat image can be identified if the image is not affected against any pair of pixels in that image, and if the image is not affected against any pixel pair arranged in the horizontal direction, but affected against other directions, the image may include horizontal objects. In this way, a strategy for pixel pair selection defines the spatial feature of interest.
Foe simplicity, let's select the counter pixel j to be paired with a focusing pixel i from the adjacent eight neighbour pixels and take a sum of them.
Here, n is the number of pairs.
The first term corresponds to a weighted image smoothing function, and the second terms is same as the eight neighbour Laplacian edge detection kernel, which are ordinary treated separately through conventional image processing. As the operations described in the above have dilation (or erosion) effects to the objects, it would be necessary to eliminate these effects.
The simplest and most fundamental application it to identify the objects in terms of spatial entities as point-like, line-like and region-like objects. Other immediate application of the method is to detect the spatial feature points such as line-start and end points, vertices or corner points, or branch-points and line crossing points.
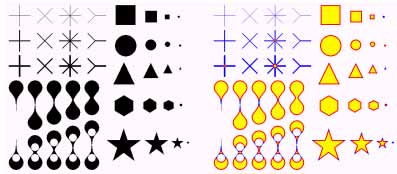
Figure 1. A test image with ideal shapes and the result of pixel swapping , using a 7x7 circular kernel. The image is divided into inner regions (yellow), boundaries (red), and lines (blue).
3. Road detction from landsata tm images:
The road network development in the forest indicates an expansion of human activities, and it is highly related to the man-made disturbances to forest ecology and forest growth. Therefore, monitoring of these changes from space is one of important applications for remote sensing.
Forest clear-cut patches appear as area-like objects in remote sensing, and it has been investigated in the previous work (J. Iisaka and et al.1995), here the line-like objects are focussed.
The following sections illustrate some direct application of the pixel swapping method to analyse remote sensing data integrating spatial and spectral information of terrain objects.
3.1. Automated line-like object detection.
Image slicing is the most popular method to extract specific objects for many image-processing applications. This threshold value is ordinary determined at locations of peaks or valleys of the histogram of pixel values distribution, or interactively by operators of image analysis. As long as the targets have specific pixel value range and are well separated in the histogram, this method extracts the target objects very well. With multispectral images, the target objects are well identified based on the spectral similarity in spectral space, and the threshold is selected from spectral similarity.
Unfortunately, most terrain covers observed in conventional remote sensing such, as Landsat TM data are not well separated in spectral space except few objects like water. Therefore, simple threshold values are difficult to select solely from the histograms.
Problem are not only separability among objects, but some objects may have several threshold levels, because the radiometric values are affected by the objects of their neighbour or background objects in that sensor resolution cell.
It is assumed that the roads and trails appear as line-like objects and brighter than other object in a scene.
For simplicity, TM brightness image is used as the roads and trails mostly appear as bright objects in a TM scene. The brightness image is created by combining the TM visible bands, TM band 1, TM band 2 and TM band 3, which is illustrated in Figure 2.Figure 2 TM Brightness
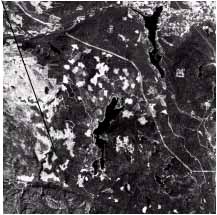
Figure 2. Image of Study Area: Watershed of Greater Victoria, BC, Canda
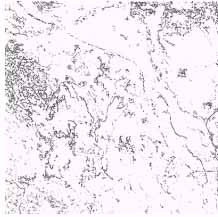
Figure 3: The Result of Line-like Object Detection
This brightness image is sliced at various thresholds starting from the maximum pixel value in the scene decreasing it with a fixed interval. With the highest threshold, no objects are extracted. With the intermediate threshold between the maximum and minimum pixel values, some objects appear as point-like objects, region like object or line-like objects. Figure 3 shows the objects extracted at the threshold that generates the maximum number of pixels for the line-like patterns.
The first experiment was conducted as follows: 1) Create a series of binary images sliced at every grey level. 2) Each binary image is processed by the pixel swapping method, and each pixel is labelled as a point, a line, or a region. 3) Then, extract only the objects labelled as line-like objects and store these results. 4) Repeat the above procedure to the image of the next slice level. 5) The result image for line-like objects is "ORed" with the previous results.
As seen in the Figure 3, many shorter line-segments are detected in the vegetated areas, and they might be the features generated by the topographic effects or tree height variability in the forest.
3.2 MODVI and Vegetation Mask
These small line-like features in the forest can be masked out using vegetation indices derived from remote sensing data.
Although the NDVI (Normalised Difference Vegetation Index: C. Tucker, 1979) is widely used as a vegetation index, it is not so reliable against radiometric environment of remote sensing. In this experiment, the MODVI (The modified Vegetation Index) is adopted in this experiment, as the MODVI is less affected by the atmospheric and solar illumination conditions. (J. Iisaka and et al. 1999, and J. Iisaka, 2000)
The MODVI is estimated by the following equation.
3.3 Fractal Based line-like Object Detection.
It is more convenient if an algorithm is able to identify the line-like object independent to the pixel values or contrast among neighbour pixels. Most of objects observed in nature are not so simple like straight lines or ploy-lines. Rather, they are characterised by fractal dimensions. As the fractal dimension of line-like objects never exceeds 2, no matter how complex they are, fractal measures can be applied to delineate line-like objects.
Let i and j be the indices of scales (the swapping window sizes) , and denote the results of pixel swapping as Si and Sj. The fractal dimension (local fractal dimension) D can be estimated from the following equation.(J. Iisaka, 1998,1999)
Therefore, it is necessary to threshold the fractal image between "1 or greater than 1" and "less than 2".
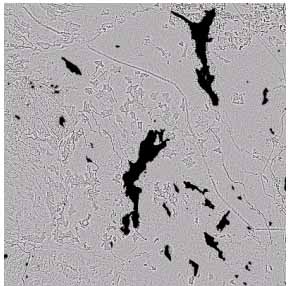
Figure 4 Fractal Image derived from the rightness image (see Figure 2.)
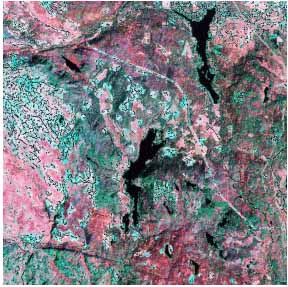
Figure 5 Road dectected in less vegetated areas
The Figure 5 is the result of roads in less vegetated areas derived using the TM data, and overlaid with TM false colour image of the study area.
4. Summary And Coclusions
It was demonstrated that terrain cover objects with specific spatial objects, roads and trails in the forest were detected well through integration of spatial and spectral information. It was also demonstrated that the method, the pixel swapping, worked well to extract spatial features of terrain objects for remote sensing.
More complex and sophisticate post processing is definitely required to create the similar feature like conventionally maps provide. This is the main subject for the future study.
5. References
Abstract
Digital image analysis techniques have been and are being used widely in remote sensing assuming that each terrain surface category is characterised with spectral signature observed by remote sensors.
Even with the remote sensing images of medium coarse resolution such as Landsat TM data, integration of spatial information is expected to assist and to improve the image analysis of remote sensing data.
This paper will describe and demonstrate a method, named as" Pixel swapping", to analyse remote sensing images in a unified way, integrating spatial information extraction as well as spectral information.
After a brief introduction of the method, some application to identify terrain objects like roads in the forest are demonstrated utilising the spatial information of objects.
1. Introduction
With remote sensing images such as LANDSAT TM data, most of digital analyses are applied through pixel-by pixel basis, assuming that each ground cover objects has their specific spectral characteristics.
The conventional digital image processing techniques, based on the field theoretic approach, have many advantages in numeric and analytical calculation such as filtering the signals and classifying terrain covers using multi-spectral characteristics of objects, but they are not so capable to handle spatial and geometrical information.(J. Richard, 1994, J. Jensen, 1995).
On the other hand, the mathematical morphology, based on a set theoretical approach, provides better capability with morphological processing of objects, but week in numeric and quantitative treatment of objects. Thus, more powerful functions to handle spatial feature extraction for remote sensing are required.
2. Spatial Information Extraction For Remote Sensing
As an extension of conventional image processing and mathematical morphology, It has been proposed a method to process spatial information in an image.(J.Iisaka,1989, 1998, 1999, 2000, and J. Iisaka, et al, 1993 and 1994)
2.1 Image Computing through Pixel Swapping.
An image is defined as a function image intensity field I with parameters of a coordinate pair, x and y as:
I= f (x, y) (2.1)
For a digital image, the set of co-ordinate value, X, is a finite set, and the function (2.1) is a projection of a set X to an element of a pixel value set, a, and can be denoted as:
I= {(x,a(x):x eX)} (2.2)
Here, a is a set of the pixel values
This equation can be rewritten again using two points, dividing it into two terms as
Let's demote the first term as
I-={(x,{a(xi)-a(xj)}/2:x eX)} (2.4)
The selection of a pixel pair between pixel i and j is arbitrary. A homogenous flat image can be identified if the image is not affected against any pair of pixels in that image, and if the image is not affected against any pixel pair arranged in the horizontal direction, but affected against other directions, the image may include horizontal objects. In this way, a strategy for pixel pair selection defines the spatial feature of interest.
Foe simplicity, let's select the counter pixel j to be paired with a focusing pixel i from the adjacent eight neighbour pixels and take a sum of them.
Here, n is the number of pairs.
The first term corresponds to a weighted image smoothing function, and the second terms is same as the eight neighbour Laplacian edge detection kernel, which are ordinary treated separately through conventional image processing. As the operations described in the above have dilation (or erosion) effects to the objects, it would be necessary to eliminate these effects.
The simplest and most fundamental application it to identify the objects in terms of spatial entities as point-like, line-like and region-like objects. Other immediate application of the method is to detect the spatial feature points such as line-start and end points, vertices or corner points, or branch-points and line crossing points.
Figure 1. A test image with ideal shapes and the result of pixel swapping , using a 7x7 circular kernel. The image is divided into inner regions (yellow), boundaries (red), and lines (blue).
3. Road detction from landsata tm images:
The road network development in the forest indicates an expansion of human activities, and it is highly related to the man-made disturbances to forest ecology and forest growth. Therefore, monitoring of these changes from space is one of important applications for remote sensing.
Forest clear-cut patches appear as area-like objects in remote sensing, and it has been investigated in the previous work (J. Iisaka and et al.1995), here the line-like objects are focussed.
The following sections illustrate some direct application of the pixel swapping method to analyse remote sensing data integrating spatial and spectral information of terrain objects.
3.1. Automated line-like object detection.
Image slicing is the most popular method to extract specific objects for many image-processing applications. This threshold value is ordinary determined at locations of peaks or valleys of the histogram of pixel values distribution, or interactively by operators of image analysis. As long as the targets have specific pixel value range and are well separated in the histogram, this method extracts the target objects very well. With multispectral images, the target objects are well identified based on the spectral similarity in spectral space, and the threshold is selected from spectral similarity.
Unfortunately, most terrain covers observed in conventional remote sensing such, as Landsat TM data are not well separated in spectral space except few objects like water. Therefore, simple threshold values are difficult to select solely from the histograms.
Problem are not only separability among objects, but some objects may have several threshold levels, because the radiometric values are affected by the objects of their neighbour or background objects in that sensor resolution cell.
It is assumed that the roads and trails appear as line-like objects and brighter than other object in a scene.
For simplicity, TM brightness image is used as the roads and trails mostly appear as bright objects in a TM scene. The brightness image is created by combining the TM visible bands, TM band 1, TM band 2 and TM band 3, which is illustrated in Figure 2.Figure 2 TM Brightness
Figure 2. Image of Study Area: Watershed of Greater Victoria, BC, Canda
Figure 3: The Result of Line-like Object Detection
This brightness image is sliced at various thresholds starting from the maximum pixel value in the scene decreasing it with a fixed interval. With the highest threshold, no objects are extracted. With the intermediate threshold between the maximum and minimum pixel values, some objects appear as point-like objects, region like object or line-like objects. Figure 3 shows the objects extracted at the threshold that generates the maximum number of pixels for the line-like patterns.
The first experiment was conducted as follows: 1) Create a series of binary images sliced at every grey level. 2) Each binary image is processed by the pixel swapping method, and each pixel is labelled as a point, a line, or a region. 3) Then, extract only the objects labelled as line-like objects and store these results. 4) Repeat the above procedure to the image of the next slice level. 5) The result image for line-like objects is "ORed" with the previous results.
As seen in the Figure 3, many shorter line-segments are detected in the vegetated areas, and they might be the features generated by the topographic effects or tree height variability in the forest.
3.2 MODVI and Vegetation Mask
These small line-like features in the forest can be masked out using vegetation indices derived from remote sensing data.
Although the NDVI (Normalised Difference Vegetation Index: C. Tucker, 1979) is widely used as a vegetation index, it is not so reliable against radiometric environment of remote sensing. In this experiment, the MODVI (The modified Vegetation Index) is adopted in this experiment, as the MODVI is less affected by the atmospheric and solar illumination conditions. (J. Iisaka and et al. 1999, and J. Iisaka, 2000)
The MODVI is estimated by the following equation.
3.3 Fractal Based line-like Object Detection.
It is more convenient if an algorithm is able to identify the line-like object independent to the pixel values or contrast among neighbour pixels. Most of objects observed in nature are not so simple like straight lines or ploy-lines. Rather, they are characterised by fractal dimensions. As the fractal dimension of line-like objects never exceeds 2, no matter how complex they are, fractal measures can be applied to delineate line-like objects.
Let i and j be the indices of scales (the swapping window sizes) , and denote the results of pixel swapping as Si and Sj. The fractal dimension (local fractal dimension) D can be estimated from the following equation.(J. Iisaka, 1998,1999)
Therefore, it is necessary to threshold the fractal image between "1 or greater than 1" and "less than 2".
Figure 4 Fractal Image derived from the rightness image (see Figure 2.)
Figure 5 Road dectected in less vegetated areas
The Figure 5 is the result of roads in less vegetated areas derived using the TM data, and overlaid with TM false colour image of the study area.
4. Summary And Coclusions
It was demonstrated that terrain cover objects with specific spatial objects, roads and trails in the forest were detected well through integration of spatial and spectral information. It was also demonstrated that the method, the pixel swapping, worked well to extract spatial features of terrain objects for remote sensing.
More complex and sophisticate post processing is definitely required to create the similar feature like conventionally maps provide. This is the main subject for the future study.
5. References
- Joji Iisaka, "Automated Detection of man-made Disturbances in the Forest From Remotely Sensed Images", Proceeding of the 2nd International Conference on Geospatial Information in Agriculture and Forestry, 10-12 January, 2000, Lake Buena Vista, FL, USA, pp. II-135-322.
- Joji Iisaka and Takako Sakurai-Amano, "A new Vegetation Index for Remote Sensing", Proceeding of the 115th symposium of the Korean Society of Remote Sensing and the Workshop of Environment Monitoring from Space for East Asia, Nov.3-5, 1999, Kangnung, Korea, 1:256-261.
- Joji Iisaka, " A Unified Image Computing Method for Spectral and Spatial Feature Extraction form Remotely Sensed Imagery," the Proceeding of SPIE Symposium on Non-linear Image Processing IX, San Jose, California, USA, pp.232-239, January 26-27, 1998.
- Joji Iisaka, Etsuko Amano and Takako Amano, " Automated forest clear cut detection from TM data" , Proceedings of the 26th Annual Symposium of Remote Sensing of Environment, Vancouver, Canada, pp.67-70, March 1996.
- Joji Iisaka and Takako Sakurai-Amano, "Terrain Feature Recognition for SAR Imagery employing Spatial Attributes of Targets," In the Proceedings of the ISPRS Commission III Symposium, SPIE Vol. 2357, pp.399-408, September 5-9, 1994.
- Joji Iisaka and Takako Sakurai-Amano, " Spatial Association Analysis for Radar Image Interpretation," In the Proceeding of the IGARSS'93, Tokyo, Japan, pp.1200-1203, August 18-21 1993.
- Joji Iisaka, "Structural Spatial Information Extraction form Remotely sensed data," In the Proceeding of the IGARSS'89, Vancouver, Canada, pp.1224-1227, July 10-14 1989.
- Compton J. Tucker, "Red and Photographic infrared Linear combinations for monitoring vegetation," Remote sensing of Environment, Vol.8 (2), pp.127-150 (May 1979).
- John A. Richards, "Remote Sensing Digital Image Analysis: An Introduction," Springer Verlag, New York, USA; ISBN: 0387582193, edition September 1994.
- John R. Jensen, Introductory Digital Image Processing: A Remote Sensing Perspective, August 24, 1995, Prentice Hall, New Jersey, USA; ISBN: 0132058405.