| GISdevelopment.net ---> AARS ---> ACRS 2000 ---> Oceanography |
Classification of algal bloom
types From remote sensing reflectance
Soo Chin LIEW, Leong Keong
KWOH, and Hock LIM
Centre for Remote Imaging, Sensing and Processing
National University of Singapore
Blk. SOC1 Level 2, Lower Kent Ridge Road, Singapore 119260
Tel: (65) 8745069 Fax: (65) 7757717
E-mail: liew_soo_chin@nus.edu.sg
SINGAPORE
Keywords : Ocean color, reflectance, algal
blooms, phytoplanktons, classificationCentre for Remote Imaging, Sensing and Processing
National University of Singapore
Blk. SOC1 Level 2, Lower Kent Ridge Road, Singapore 119260
Tel: (65) 8745069 Fax: (65) 7757717
E-mail: liew_soo_chin@nus.edu.sg
SINGAPORE
Abstract
A technique for classification of phytoplankton bloom types from remote sensing reflectance is described in this paper. Several minor algal bloom events were sighted and their characteristics reflectance signatures were collected using a handheld spectrometer during a series of sea-truth water sampling campaigns carried out from Dec 1996 to Dec 1999 in coastal waters around Singapore. Reflectance spectra of two additional algal bloom classes were also collected during two field trips to the Manila Bay. In order to assess the potential of utilizing satellite ocean color sensors for algal bloom detection and classification, reflectance data for the SeaWiFS and future MERIS sensor spectral bands were simulated from the in-situ radiance data. An algorithm based on the singular value decomposition (SVD) technique was then applied for classification of algal bloom types from the simulated satellite sensor reflectance data. The results show that all the eight algal bloom classes can be distinguished from the clear sea water reference sample. The average accuracy of classification using this technique for all the classes are 98.6% (for MERIS) and 96.6% (for SeaWiFS), in comparison to 87.5% (MERIS) and 73.8% (SeaWiFS) if the reflectance values are used.
1. Introduction
Phytoplantons (or algae) constitute the base of the marine food web. However, algal blooms may cause harm by shading other aquatic life, depleting the dissolved oxygen content, and causing paralytic or diarrhetic shellfish poisoning (Richardson 1997). It is important to monitor occurrences of algal blooms due to their strong social, economic and health impacts. Satellite remote sensing measurement of ocean color provides a tool complementary to in-situ sea-truth measurements for algal bloom monitoring. As the individual phytoplankton pigments are characterized by their unique light absorption features, this property allows detection and identification of algal blooms by ocean color remote sensing technique (Cullen et al. 1997, Kahru and Mitchell 1998, Sathyendranath et al. 1994),
Currently, the SeaWiFS sensor on board the Orbview 2 satellite (launched October 1997) provides ocean color data with about 1-km resolution. It has six bands in the visible region and two in the near-infrared region. Each band has a 20-nm bandwidth. The recently launched MODIS sensor on board the NASA's Terra satellite has eight ocean color bands in the visible spectral region, with 10 nm bandwidth. The other recent sensor was the OCTS onboard the Japan's ADEOS satellite launched in August 1996. ADEOS ceased operation in June 1997 when the ADEOS satellite stops its operation. It was the first second-generation ocean color sensor after the 10 years gap since NASA's CZCS. Future planned ocean color sensors include the NASDA's ADEOS2-GLI and ESA's ENVISAT-MERIS. These future sensors have more wavelength bands, all with about 10 nm bandwidths. With the availability of these ocean color satellites, it is foreseeable that satellite ocean color data will play an increasingly important role in the monitoring of algal blooms. Algorithms for algal bloom detection and for classification of algal bloom types will be required.
In this paper, we describe a method of detecting and classifying algal bloom types based on the singular value decomposition technique. Satellite remote sensing reflectance signatures for several types of algal blooms were simulated using in-situ reflectance data measured during a series of water sampling campaigns around Singapore and in Manila Bay. The satellite sensors tested are SeaWiFS and MERIS.
2. Algal Bloom Classes
Sea-truth water sampling campaigns were carried out from Dec 1996 to Dec 1999 in coastal waters around Singapore (Lin et al. 1999, Liew et al. 2000). In-situ reflectance spectra from sea water surface were acquired using a portable spectroradiometer. Several minor algal bloom events were sighted and their characteristic reflectance signatures were collected during this period. The classes of algal blooms observed include: Trichodesmium (a type of cyanobacteria); Chain forming diatoms; Chochlodinium (naked dinoflagellate); Dinoflagellates predominantly Dinophysis caudata; Diatoms (Rhizolenia Sp.); and mixture of chain forming diatoms (Skeletonema type) with some armoured dinoflagellates. Two additional algal bloom classes were collected during two field trips to the Manila Bay. One trip was carried out during the algal bloom episode (mainly Ceratium and Pyrodinium Bahamense) in Aug 1998, and the other in March 2000. Although there was no report of red tide during the later trip, results of water sampling in Manila Bay indicated that there were signs of increasing phytoplankton counts. A class of sea water reference spectra for sea water samples with low chlorophyll and low suspended solids was also collected during the regular water sampling field trips.
Altogether eight algal bloom classes and one reference sea water class are used in the analysis. The nine classes of spectra are tabulated in Table 1.
| Class | Description |
| 1 | Clear sea water reference (Singapore) |
| 2 | Trichodesmium (Singapore) |
| 3 | Chain forming diatoms (Singapore) |
| 4 | Cochlodinium (Singapore) |
| 5 | Ceratium and Pyrodinium Bahamense (Manila Bay) |
| 6 | Dinoflagellates (mainly Dinophysis caudata)(Singapore) |
| 7 | Diatoms (Rhizolenia Sp.)(Singapore) |
| 8 | Chain forming diatoms (Skeletonema) with some armoured dinoflagellates(Singapore) |
| 9 | Protoperidinium and Ceratum (Manila Bay) |
3. Spectral Reflectance Signatures Of Algal Bloom Classes
Spectral reflectance refers to the ratio of the detected radiance reflected from a target surface to the total incidence irradiance. In this project, a handheld spectrometer (GER 1500) was used to measure the radiance reflected from the sea surface. The detected radiance from the sea surface was normalized by the radiance reflected off the surface of a reference white plate to obtain the reflectance of the sea surface. The spectrometer has 512 wavelength channels covering the wavelength from 350 nm to 1050 nm, with a wavelength resolution of 2 nm.
From the collected spectra, SeaWiFS and MERIS data are simulated according to the band specifications shown in Table 2. The simulation is done by integrating the spectrometer radiance within each specified wavelength window to obtain the desired radiance for the corresponding SeaWiFS and MERIS channels. A flat spectral response curve is assumed for each of the satellite sensor channels. Only the channels in the visible region (400 nm to 760 nm) are considered in the simulation. Hence, the first 6 bands of the SeaWiFS sensor and the first 10 bands of the MERIS sensor are simulated. The simulated SeaWiFS and MERIS spectral reflectance data for the reference sea water and the eight algal bloom classes are shown in Fig. 1. Each spectrum shown in Fig. 1 is the mean of a set of spectra corresponding to the reference sea water and each of the algal bloom classes. The spectra have been normalized so that each of them has a mean value of zero and a variance of one. In this way, the magnitude of reflectance has no influence on the normalized spectra, and the shapes of the spectra can be compared directly.
| MERIS | |||||||||||||||
| BN | 1 | 2 | 3 | 4 | 5 | 6 | 7 | 8 | 9 | 10 | 11 | 12 | 13 | 14 | 15 |
| BC | 412.5 | 442.5 | 490 | 510 | 560 | 620 | 665 | 681.25 | 705 | 753.75 | 760 | 775 | 865 | 890 | 900 |
| BW | 10 | 10 | 10 | 10 | 10 | 10 | 10 | 7.5 | 10 | 7.5 | 2.5 | 15 | 20 | 10 | 10 |
| SeaWiFS | |||||||||||||||
| BN | 1 | 2 | 3 | 4 | 5 | - | 6 | - | - | - | 7 | - | 8 | - | - |
| BC | 412 | 443 | 490 | 510 | 555 | - | 670 | - | - | - | 765 | - | 864 | - | - |
| BW | 20 | 20 | 20 | 20 | 20 | - | 20 | - | - | - | 40 | - | 40 | - | - |
Note: BN = Band Number, BC = Band Centre (nm), BW = Band Width (nm)
It can be seen that the MERIS spectra of the eight algal bloom classes are quite distinct from each other. For many algal bloom types, the spectra can be differentiated visually from their shapes around the chlorophyll absorption band at 670 nm. In comparison, the SeaWiFS does not have spectral bands beyond 670 nm. Hence, it is expected that SeaWiFS will fare poorer in terms of accuracy in classification of the algal bloom types.
4. Classification of Algal Blooms from Reflectance
An algorithm based on the singular value decomposition (SVD) technique (Danaher and Omongain 1992) has been developed for the detection and classification of algal bloom types from reflectance data. This algorithm is a type of supervised classification technique. In this algorithm, a "key vector" Vi(l) for each algal bloom class labelled by the subscript i is first determined from the reflectance spectra of the algal bloom class of interest measured during the field trips. This key vector acts as a sort of template for this class of algal bloom. A given measured spectrum R(l) to be classified is then "matched" to this key vector using the dot-product operation to give a key value wi. Mathematically, the dot-product operation is represented by the formula:

Ideally, if the spectrum R(l) belongs to class-i, then wi=1, otherwise wi=0. Using a training set of spectra of known classes, the key vector for each of the nine classes (8 algal bloom classes + 1 reference sea water class) are obtained using the singular value decomposition technique. The key vectors are then matched to each of the unknown spectra R(l) to be classified, using the dot-product operation. In this way, each spectrum is transformed into a vector of nine key values. The results of supervised minimum distance classification in the key value space are shown in Tables 3 and 4 for the SeaWiFS and MERIS sensors respectively. For comparison, the results of supervised minimum distance classification using normalized spectral values of the respective sensors are shown in Tables 5 and 6.
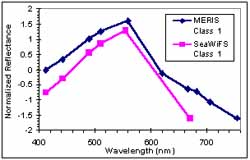
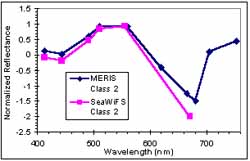
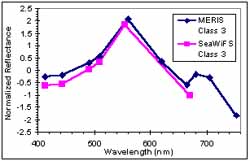
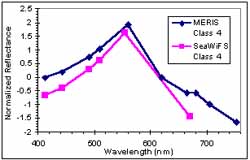
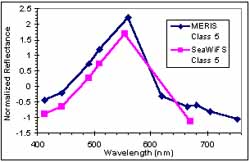
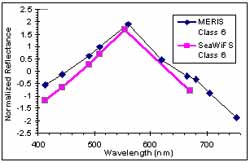
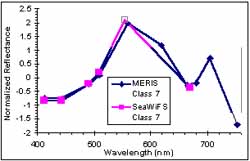
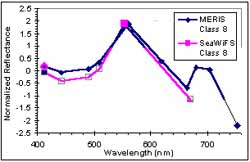
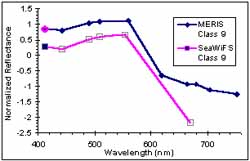
Figure 1: Simulated SeaWiFS and MERIS spectra for the reference sea water class (class 1) and the 8 algal boom classes (Class 2 to 9)
| Assigned Class(%) | ||||||||||||
| 1 | 2 | 3 | 4 | 5 | 6 | 7 | 8 | 9 | Total (%) | |||
| Actual Class |
1 | 100 | 0 | 0 | 0 | 0 | 0 | 0 | 0 | 0 | 100 | |
| 2 | 0 | 69.6 | 0 | 0 | 0 | 0 | 0 | 0 | 30.4 | 100 | ||
| 3 | 0 | 0 | 100 | 0 | 0 | 0 | 0 | 0 | 0 | 100 | ||
| 4 | 0 | 0 | 0 | 100 | 0 | 0 | 0 | 0 | 0 | 100 | ||
| 5 | 0 | 0 | 0 | 0 | 100 | 0 | 0 | 0 | 0 | 100 | ||
| 6 | 0 | 0 | 0 | 0 | 0 | 100 | 0 | 0 | 0 | 100 | ||
| 7 | 0 | 0 | 0 | 0 | 0 | 0 | 100 | 0 | 0 | 100 | ||
| 8 | 0 | 0 | 0 | 0 | 0 | 0 | 0 | 100 | 0 | 100 | ||
| 9 | 0 | 0 | 0 | 0 | 0 | 0 | 0 | 0 | 100 | 100 | ||
Average Overall Accuracy 96.6 %
Table 4: Minimum distance classification in the key value space for MERIS
| Assigned Class(%) | ||||||||||||
| 1 | 2 | 3 | 4 | 5 | 6 | 7 | 8 | 9 | Total (%) | |||
| Actual Class |
1 | 100 | 0 | 0 | 0 | 0 | 0 | 0 | 0 | 0 | 100 | |
| 2 | 13.0 | 87.0 | 0 | 0 | 0 | 0 | 0 | 0 | 0 | 100 | ||
| 3 | 0 | 0 | 100 | 0 | 0 | 0 | 0 | 0 | 0 | 100 | ||
| 4 | 0 | 0 | 0 | 100 | 0 | 0 | 0 | 0 | 0 | 100 | ||
| 5 | 0 | 0 | 0 | 0 | 100 | 0 | 0 | 0 | 0 | 100 | ||
| 6 | 0 | 0 | 0 | 0 | 0 | 100 | 0 | 0 | 0 | 100 | ||
| 7 | 0 | 0 | 0 | 0 | 0 | 0 | 100 | 0 | 0 | 100 | ||
| 8 | 0 | 0 | 0 | 0 | 0 | 0 | 0 | 100 | 0 | 100 | ||
| 9 | 0 | 0 | 0 | 0 | 0 | 0 | 0 | 0 | 100 | 100 | ||
Average Overall Accuracy 98.6 %
Table 5: Minimum distance classification in the normalized spectral value space for SeaWiFS
| Assigned Class(%) | ||||||||||||
| 1 | 2 | 3 | 4 | 5 | 6 | 7 | 8 | 9 | Total (%) | |||
| Actual Class |
1 | 97.5 | 2.5 | 0 | 0 | 0 | 0 | 0 | 0 | 0 | 100 | |
| 2 | 4.35 | 91.3 | 0 | 0 | 0 | 0 | 0 | 0 | 4.35 | 100 | ||
| 3 | 0 | 2.5 | 42.5 | 5.0 | 0 | 0 | 37.5 | 0 | 12.5 | 100 | ||
| 4 | 0 | 20 | 0 | 50 | 20 | 10 | 0 | 0 | 0 | 100 | ||
| 5 | 0 | 0 | 0 | 0 | 77.8 | 22.2 | 0 | 0 | 0 | 100 | ||
| 6 | 0 | 0 | 0 | 0 | 10 | 90 | 0 | 0 | 0 | 100 | ||
| 7 | 0 | 0 | 0 | 0 | 0 | 0 | 100 | 0 | 0 | 100 | ||
| 8 | 0 | 0 | 0 | 0 | 0 | 0 | 50 | 25 | 25 | 100 | ||
| 9 | 0 | 10 | 0 | 0 | 0 | 0 | 0 | 0 | 90 | 100 | ||
Average Overall Accuracy: 73.8%
Table 6: Minimum distance classification in the normalized spectral value space for MERIS
| Assigned Class(%) | ||||||||||||
| 1 | 2 | 3 | 4 | 5 | 6 | 7 | 8 | 9 | Total (%) | |||
| Actual Class |
1 | 100 | 0 | 0 | 0 | 0 | 0 | 0 | 0 | 0 | 100 | |
| 2 | 0 | 69.6 | 0 | 0 | 0 | 0 | 0 | 0 | 30.4 | 100 | ||
| 3 | 0 | 0 | 57.5 | 15 | 0 | 0 | 15 | 2.5 | 10 | 100 | ||
| 4 | 20 | 0 | 0 | 60 | 0 | 20 | 0 | 0 | 0 | 100 | ||
| 5 | 0 | 0 | 0 | 0 | 100 | 0 | 0 | 0 | 0 | 100 | ||
| 6 | 0 | 0 | 0 | 0 | 0 | 100 | 0 | 0 | 0 | 100 | ||
| 7 | 0 | 0 | 0 | 0 | 0 | 0 | 100 | 0 | 0 | 100 | ||
| 8 | 0 | 0 | 0 | 0 | 0 | 0 | 0 | 100 | 0 | 100 | ||
| 9 | 0 | 0 | 0 | 0 | 0 | 0 | 0 | 0 | 100 | 100 | ||
Average Overall Accuracy: 87.5%
The accuracy of minimum distance classification using the normalized spectral reflectance values of the SeaWiFS sensors is only 73.8%. With four additional bands of the MERIS sensor, the accuracy improves to 87.5 % (see Tables 5 and 6). This improvement is expected, as the additional bands are located around the chlorophyll-a absorption band at 670 nm, which helps to discriminate between the algal bloom classes. The transformation of the reflectance spectra into the key value space using a simple matrix multiplication operation improves the classification accuracy to 96.6% and 98.6% for SeaWiFS and MERIS respectively (see Tables 3 and 4). It is noted that for both SeaWiFS and MERIS sensors, the spectra from eight out of nine classes are correctly classified after transformation into the key values. The only class that performs poorly is class 2 (Trichodesmium).
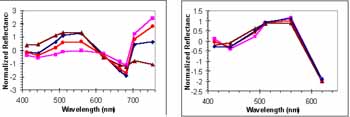
Figure 2: Samples of MERIS (left) and SeaWiFS (right) reflectance spectra of class 2 (Trichodesmium)
Samples of the reflectance spectra of class 2 (Trichodesmium) are shown in Fig. 2. For MERIS, all the class 2 reflectance spectra have similar shapes in the shorter wavelength (<650 nm) region. The variation is greater in the longer wavelength region. Hence, it is expected that some spectra be misclassified. For SeaWiFS, the within class variation is smaller. However, the class 2 spectra shape is very similar to class 9 and hence many spectra are misclassified as class 9.
5. Concluding Remarks
We have presented a technique for classification of algal blooms types from remote sensing reflectance. This technique is based on a linear transformation of the normalized reflectance spectra into a "key value" space. The success of this technique depends on the availability of spectral reflectance signatures of known algal bloom classes. The key vectors required for constructing the transformation matrix are derived from this set of reflectance signatures. The present database of algal bloom signatures used in this study have been accumulated during a 3-year period of water sampling in Singapore waters and in the Manila Bay. The classification technique is tested on the simulated data for the current SeaWiFS and future MERIS ocean color sensors. The simulated data are constructed from in-situ radiance data measured using a handheld spectrometer. Atmospheric effects are not included in the simulation. Hence, it is assumed that atmospheric correction has been done before the classification technique is applied. This study show that the spectral bands of the current SeaWiFS sensor is sufficient for algal bloom classification, while the MERIS sensor provides certain advantages in identifying different algal bloom types.
Acknowledgments
The authors acknowledge support from SPOT Asia Pte. Ltd, in the form of a grant awarded by the Regional Institute of Environmental Technology (RIET) under the Asia-EcoBest Work Programme '99. Some of the data used in this study were obtained during field trips conducted with partial funding from the National Space Development Agency of Japan (NASDA) through a joint NASDA-ESCAP project entitled "National capacity building for sustainable environment and natural resources management through research and studies on the uses of ADEOS data". The authors would like to thank Dr Michael Holmes of the Department of Biological Sciences and the Tropical Marine Science Institute (TMSI), National University of Singapore (NUS); Dr Serena Teo of TMSI, NUS; Dr Karina Gin of the Department of Civil Engineering, NUS; and Dr. I-I Lin (currently at the National Centre for Ocean Research, National Taiwan University) for their contributions in the water sampling field trips in Singapore. The assistance rendered by Prof. Rhodora Azanza and Ms Arlynn Gedaria of the Marine Science Institute, University of philippines at Diliman during the field trips in Manila Bay is gratefully acknowledged.
References
- Cullen, J. J., A. M. Ciotti, R. F. Davis, and M. R. Lewis (1997), Optical detection and assessment of algal blooms, Limnology and Oceanography, 42(5), 1223-1239.
- Danaher, S. and E. Omongain (1992), Singular value decomposition in multispectral radiometry, Int. J. Remote Sens. 13, 1771-1777.
- Kahru, M. and B. G. Mitchell (1998), Spectral reflectance and absorption of a massive red tide off southern California, Journal of Geophysical Research 103(C10), 21601-21609.
- Liew, S. C., I-I Lin, H. Lim, L. K. Kwoh, M. Holmes, S. Teo, S. T. Koh, and K. Gin (2000), Tropical algal bloom monitoring by sea truth, Paper presented at 28th International Symposium on Remote Sensing of Environment, 27 - 31 March, 2000, Cape Town, South Africa.
- Lin, I-I, S. C. Liew, H. Lim, L. K. Kwoh, M. Holmes, S. Teo, S. T. Koh and K. Gin (1999), Classification of Tropical Algal Bloom Types By Sea Truth Spectral-Radiometric Data, Proc. 20th. Asian Conference for Remote Sensing, 22-25 November 1999, Hong Kong, China.
- Richardson, K. (1997), Harmful or Exceptional Phytoplankton Blooms in the Marine ecosystem. Adv. Mar. Biol. 31, 301-385.
- Sathyendranath, S., F. E. Hoge, T. Platt, and R. N. Swift (1994), Detection of phytoplankton pigments from ocean color: improved algorithms, Applied Optics 33, 1081-1089.