| GISdevelopment.net ---> AARS ---> ACRS 2000 ---> Oceanography |
Derivation of Aerosol Optical
Thickness over the East Asian Oceans with ROCSAT-1 OCI Imagery
Shih-Jen Huang* and
Gin-Rong Liu**
*Institute of Space Science National Central University
320 Chung-Li, Taiwan
E-mail:huang@sun4.oce.ntou.edu.tw
** Professor, Center for Space and Remote Sensing Research
National Central University
320 Chung-Li, Taiwan
E-mail:grliu@csrsr.ncu.edu.tw
Keywords: aerosol optical thickness, dust
storm, ocean color imager (OCI)*Institute of Space Science National Central University
320 Chung-Li, Taiwan
E-mail:huang@sun4.oce.ntou.edu.tw
** Professor, Center for Space and Remote Sensing Research
National Central University
320 Chung-Li, Taiwan
E-mail:grliu@csrsr.ncu.edu.tw
Abstract
The goal of this study is to derive the Aerosol Optical Thickness (AOT) pixel-by-pixel over ocean with ROCSAT-1 OCI imagery. The result shows that there is a high correlation between the AOT assessed from our procedure and from the SeaWiFS' operational atmospheric correlation package, SeaDAS, revealing that our method is acceptable. In the future study, OCI imagery and our procedure can be used to derive AOT distributions for the monitoring of the air quality and dust storm which comes from the northwestern and northern Mainland China.
1. Introduction
The atmosphere contains suspended particles, ranging in size from about 10-3 mm to about 20 mm, called aerosols. These aerosols are produced directly by natural processes and human activities. Natural aerosols include volcanic dust, sea spray, and its particulate product etc. Aerosols not only scatter but also significantly absorb the incoming solar radiation covering the entire spectrum (Liou, 1980).
Since these particles can scatter and absorb the radiance, the atmospheric aerosols directly influence the radiance reflected to space. Aerosol also provides cloud condensation nuclei that lead cloud formation and affect the earth radiation budget. In general, the Aerosol Optical Thickness (AOT) is one indicate of aerosol optical properties. The AOT over the ocean with measurements from the Advance Very High Resolution Radiometer (AVHRR) (Rao et al. 1989, Ignatov et al. 1995) and become routinely operation in the National Oceanic and Atmospheric Administration (NOAA).
In the recent years, the ground in situ measurements and the retrieved aerosol optical properties using air- and space born sensors (King et al., 1999). The global aerosol optical property monthly composite images are retrieved from two near-infrared bands (765 and 865nm) of Sea-viewing Wide Field-of-view Sensor (SeaWiFS) (Wang et al., 2000). In this paper, the ROCSAT-1/OCI images will be used to estimate the AOT and to draw out the time variation of AOT adjacent Taiwan area.
2. Methodology
The primary goals of Ocean Color Imager ROCSAT-1, which was successfully launched on January 27 1999, are to measure the middle and low latitude ocean color and generate ocean bio-optical property products (Li et al., 1998). However, when we retrieve the ocean surface signal from measured radiance at the satellite sensors, the atmospheric effects must be removed. Studies show that the atmospheric correction removes almost more than 90% of the observed radiance at visible wavelength measured at the satellite sensor.
The OCI bands are similar to the SeaWiFS channels, but lack the 412 and 765nm bands (Liu et al., 1999). In this study, we developed an algorithm called OCITRAN. It uses two OCI bands (670 and 865nm) radiance to determinate the air mass character and sea surface albedo. After the air mass character is decided, we can estimate the aerosol size distribution and get the Angstrom exponent. Therefore, the AOT of OCI bands can be found because of the Angstrom exponent, which is related to the wavelength dependence of the AOT.
3. Results
To validate the AOT algorithm, two SeaWiFS data sets are input to our algorithm and SeaDAS respectively. Those images covering the Taiwan area and the northern South China Sea were acquired at 0423z, March 25 and 0414z, April 16, 1999. The ground resolution was about 1.1x1.1km at nadir. In order to study the AOT variance, 14 OCI images covering the Taiwan area (Table 1) are used.
In order to validate the AOT retrieved algorithm, we compare the result of this algorithm and that of SeaWiFS operational model SeaDAS with two SeaWiFS data sets. The result shows that the AOT estimated by our algorithm and the SeaDAS model has a rather good consistency. Their correlation coefficients are 0.87 and 0.89 for two data sets, respectively. And their standard deviations are 0.0264 and 0.0267 (Figure 1). We also use the AERONET (AErosol RObotic NETwork) in situ measurement data at Anymon and Chinhae in Southern Korea to examine the AOT derived from OCI data. The AERONET program is a worldwide ground-based remote sensing aerosol network. Its goal is to assess aerosol optical properties and validate satellite retrievals of aerosol optical properties. Owing to the constraint of ROCSAT-1 mission and cloud contamination, there are only 3 data pairs for OCI and AERONET data. Their acquisition time are May 13 0603z, Oct. 24 0517z, and Nov. 2 0129z. The derived AOT from OCI 865nm band compared with the Aeronet measurement data is shown in Figure 2. Their correlation coefficient is 0.995 and standard deviation is 0.0069. Therefore, the AOT algorithm in this study is feasible.
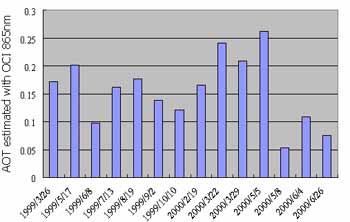
For the purpose of understanding the variation of AOT on the East Asian Ocean, we selected 14 OCI images (from March 1999 to June 2000) around Taiwan area and process them with our algorithm. The AOT was taken 1°x1° space average under clear sky condition. The Figure 3 shows the fluctuation of average AOT located on (23N, 119E) near Penghu. The higher AOT observed in March and May. The lower AOT value appeared in June. According to the report of the environment information of China, the Mainland's dust storm happened on April 3-4, 1999 and March 22-23 and 27, 2000. The pattern of Figure 3 is similar to the dust storm existence time but has some time lag. Perhaps the high AOT value has some relationship with the dust storm.
4. Conclusion
From the comparison of SeaWiFS data, the results of this study have high correlation with those of SeaDAS. The AOT also agrees with the AERONET in situ data. We will find more data pairs of OCI and AERONET measurements to validate our algorithm in the future. However, the algorithm developed in this study is capable to retrieve the AOT. According to our result, the seasonal fluctuation of AOT can be revealed clearly with OCI data. The serious aerosol will occur in spring and fall. It shows that the Mainland's dust storm may affect the atmosphere constituent around Taiwan area. Because of its 35° inclination and on-board memory space limitation, ROCSAT-1 OCI can not take image in same area during short period. Hence, we will try to map the aerosol distribution and monthly aerosol variation with multi-temporal OCI images in next study.
Acknowledgements
The SeaWiFS data, used in this study, were provided by the Goddard DAAC, NASA, USA. The OCI data were provided by the OCI Data Distribution Center, NSPO, Taiwan. This study was supported by the NSPO, NSC, with the grant of NSC89-NSPO-A-OCI-019-01-02.
References
- Ignatov, A. M., L.L. Stowe, S. M. Sakerin, and G.K. Korotaev, 1995: Validation of the NOAA/NESDIS satellite aerosol product over the North Atlantic in 1989. J. Geophy. Res. Vol. 100, No. D3, pp.5123-5132.
- King, M.D., Y.J. Kaufman, D. Tanre, and T. Nakajima,1999: Remote sensing of tropospheric aerosols from space: Past, present, and future, Bull. Am. Meterolo. Soc., 80, pp.2220-2259.
- Li, H.W., C.R. Ho, N.J. Kuo, S.J. Huang, and W. P. Tsai, 1998: ROCSAT-1/OCI-A low-latitude covering spaceborne ocean color sensor. 5th Inter. Conf. On Remote Sensing for Marine Coastal Environments, San Diego, California, 5-7 Oct. 1998, pp.245-251.
- Liou, K. N., 1980. An introduction to atmospheric radiation, Academic Press, New York, pp.234-292.
- Liu, G.R., S.J. Huang, T.H. Kuo, W. J. Chen and C. Y. Tseng, 1999. The atmospheric effect correction of the Ocean Color Imager of ROCSAT-1-simulations and using SeaWiFS data as the example, TAO, Supplementary Issue, 99-114.
- Rao, C.R.N., L.L. Stowe, and E.P. McClain, 1989: Remote sensing of aerosols over the oceans using AVHRR data Theory, practice and applications. Int. J. Remote Sensing, Vol. 10, No. 4, pp.743-749.
- Wang, M.H., S. Bailey, and C. R. McClain, 2000. SeaWiFS provides unique global aerosol optical property data. EOS, Trans. AGU, Vol. 81, pp.197-202.
| Date | UTC | Date | UTC |
| 1999/3/26 | 0205z | 2000/2/19 | 0215z |
| 1999/5/17 | 0211z | 2000/3/22 | 0411z |
| 1999/6/8 | 2321z | 2000/3/29 | 0115z |
| 1999/7/13 | 0710z | 2000/5/5 | 0754z |
| 1999/8/19 | 0713z | 2000/5/8 | 0707z |
| 1999/9/2 | 0122z | 2000/6/4 | 0139z |
| 1999/10/10 | 0717z | 2000/6/26 | 0831z |
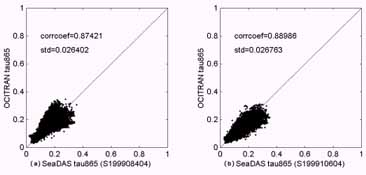
Figure 1. The Comparison of aerosol optical thickness derived from SeaWiFS data by the OCITRAN and the SeaDAS models.
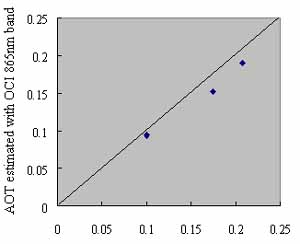
aeronet oberved AOT
Figure 2. The comparison of aerosol optical thickness at 865nm band derived from OCI data and Aeronet data observed on Southern Korea (Corrcoef=0.995, std=0.0069).
date
Figure 3. The variation of averaged aerosol optical thickness retrieved from OCI 865nm band around Penghu (23N, 119E).