| GISdevelopment.net ---> AARS ---> ACRS 2000 ---> Oceanography |
El niño southern oscillation
(enso) impact on sea surface temperature (sst) derived from satellite
imagery and its relationship on tuna fishing ground In the south java
seawaters
Jonson Lumban Gaol, and
Djisman Manurung
Academic staff, Marine Science and Technology Department,
Faculty of Fisheries and Marine Science, Bogor Agricultural University
Kampus IPB Darmaga, Bogor 16680, Indonesia
Tel: (62)-251-621211 Fax: (62)-251-622907
E-mail:jonsonl@mailcity.com
INDONESIA
Keywords: ENSO, SST, Imagery, Tuna, Fishing
Ground.Academic staff, Marine Science and Technology Department,
Faculty of Fisheries and Marine Science, Bogor Agricultural University
Kampus IPB Darmaga, Bogor 16680, Indonesia
Tel: (62)-251-621211 Fax: (62)-251-622907
E-mail:jonsonl@mailcity.com
INDONESIA
Abstract :
El Niño Southern Oscillation (ENSO) impact on sea surface temperature (SST) derived from satellite imagery in the south Java seawaters has been investigated. The ENSO years is defined as the years that fall during El Niño events and the standard deviation of the Southern Oscillation Index <= -1.5. Therefore, the ENSO year in this paper is 1998 and non-ENSO year is 1996. SST monthly mean for the years of 1996 and 1998 is estimated from AVHRR LAPAN (Indonesia) receiver. Monthly mean SST values during Non-ENSO years along the south Java seawaters are higher than that of the ENSO years with the average different of 1.7°C. Total big eye tuna catch in 1996 and 1998 are 30.401 fish and 42.209 fish respectively. On the other word, big eye tuna catch during ENSO year is higher than that Non-ENSO year.
1. Introduction
1.1. Background
The South Java seawater is one of the important tuna fishing ground in the world. Japan Fisheries Agency has observed sea surface temperature (SST) and current by using BT and long line drift in the south of Java since 1960s (Mizuno, 1995). SST is one of important parameter on oceanographic factors that allow a forecast of fish distributions. ENSO event are changes in SST, change in vertical, thermal structure of the ocean and altered coastal and upwelling current. Generally, in Indonesian Seawaters, correlation between fish catch and ENSO consistent in the time and space domain (Pariwono, 1996).
The Southern Oscillation is an inter-annual see-saw in tropical sea level pressure between the eastern and western hemisphere, with center action located over Indonesia and the tropical South Pacific Ocean (Philander, 1997; Quin et al., 1987). The Southern Oscillation index is the sea level pressure different between Darwin (12.4°S, 130.9°E) in northern Australia and Tahiti (17.5°S, 149.67°W) in the South Pacific Ocean with a high negative value indicate a warm event and a high positive value indicate a cold event (also referred to La Niña). However, it is important to note that there is not a one-to-one correspondence between the occurrence of Southern Oscillation events and El Niño events.
The scientific community uses the term El Niño Southern Oscillation (ENSO), combination of El Niño (ocean component of ENSO) and Southern Oscillation (atmospheric component of ENSO), to identify cases of warm eastern and central equatorial Pacific Sea Surface Temperature (SST) anomalies (Philander, 1990; Trenberth, 1991; Quin et al. 1987; Bigg, 1986).
ENSO events occur irregularly at intervals of 2-7 years, at an average of about 3-4 years. They typically last 12-18 months and affect weather, climate, marine ecosystems, terrestrial ecosystems, and economies worldwide (Polis, 1997). The ENSO event of 1997/1998 is recognized to be the strongest ENSO in recorded history. It is causing a very long drought in Southeast Asian Countries and in Australia with severe economic consequences. In the United States, ENSO has caused heavy rain and increasing number of typhoons and hurricanes in the eastern Pacific Ocean compared to non-ENSO years.
Studies about ENSO's impacts on SST in Pacific Ocean have been numerous. Meanwhile, very few studies have been conducted in Indonesian Seawaters, and specifically in the south Java seawaters. The objective of this study is to investigate the impact on ENSO evidences on SST derived from satellite imagery in the Java Sea and it's surrounding and its relationship on tuna catch.
2. Methodology
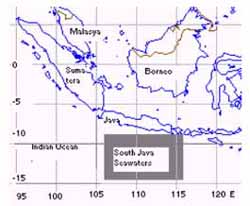
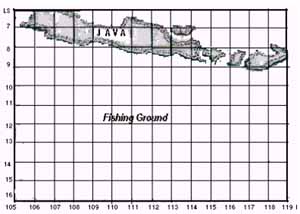
The study sites were the fishing ground of "PT Perikanan Samudra Besar" fishing fleet in the south Java seawaters (Fig. 1). There are 10 tuna fishing vessel operated in this area every day. Tuna catch data were obtained from daily logbook for period 1996 and 1998. These data are compiled in the gird of 1° longitude and latitude and are plotted in map.
SST data are derived from satellite imagery from the LAPAN (Indonesian Agency for Aerospace) local area coverage for 1996 and 1988 in the south Java seawaters. Twelve boxes are selected around the south Java seawaters for study areas.
 |
 |
|
| |
SST for AVHRR LAPAN local area coverage is estimated using formula McMillan and Crosby: SST = TW4 + 2.702 (TW4-TW5) -0.528-273.0 oC, where TW4 and TW5 are channel-4 and channel-5 of NOAA-AVHRR.
ENSO year herein are defined as years with standard deviation value of Southern Oscillation Index (SOI) <= -1.5 (Fig. 2). The determination for this value is based on the literature of ENSO years, which fall into above SOI range. Therefore, in this study, ENSO year is 1998 and non-ENSO year is 1996. Descriptive statistic is used to compare monthly mean SST during ENSO years versus non-ENSO years. T-test is used to test the statistical significant of monthly mean of ENSO years versus non-ENSO years.
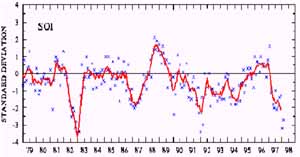
Fig. 2. Standard Deviation of Southern Oscillation Index for Determining ENSO Years.
3. Result and Discussion
3.1. SST in the South Java Seawaters
Monthly mean SST for each station of twelve selected stations during non-ENSO and ENSO years are presented at Table 1. The average of SST from all selected twelve stations range from 26.0°C to 28.5°C for non-ENSO years and from 25.9 °C to 27.1°C during the ENSO year.
|
|
|
|
|
|
|
|
|
|
|
|
|
|
|
|
|
|
|
|
|
|
|
|
|
|
|
|
|
|
|
|
|
|
|
|
|
|
|
|
|
|
|
|
|
|
|
|
|
|
|
|
The monthly mean SST plots for each station during non-ENSO and ENSO years are presented in Figure 3. In general, monthly mean SST value in the south Java seawaters for the Non-ENSO year is higher than that of the ENSO year with the average different of 1.7°C. The lower monthly mean SST during ENSO year could be connected to the cold front shifted to the north in South Pacific, east of Australia. That cold front affecting the south Java seawaters by passing Arafuru Sea.
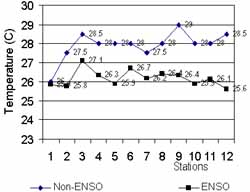
Fig. 3. SST Average Non-ENSO (1996) versus ENSO Year (1998).
In July to September, SST near Bali Island is lower than that it's surrounding. This phenomenon known as indicator of upwelling process.
3.2 Tuna Catch in South Java Seawaters
Based on the "PT Perikanan Samudra Besar" tuna fishing vessels catches, big eye tuna is the dominant catches beside yellow fin tuna in south Java seawater in 1996 and 1998. Total big eye tuna catch for each month is shown in Table 2. Total tuna catches in 1996 and 1998 are 30,401 fishes and 42,209 fishes respectively. On the other word, the big eye tuna catch in ENSO year is higher than that non-ENSO year.
|
|
|
|
| February |
|
|
| March |
|
|
| April |
|
|
| May |
|
|
| June |
|
|
| July |
|
|
| August |
|
|
| September |
|
|
| October |
|
|
| November |
|
|
| Total |
|
|
The highest big eye tuna catch in south Java seawaters in 1998 is related to the lower SST in ENSO year. Temperature changing in ENSO year can directly affect the abundance of big eye. In ENSO year is predicted that big eye tuna move up to sea surface because temperature in deeper water is too cold.
In 1996, the higher tuna catches occur for period of May, June and July, with maximum catches (2814 fishes) in June. In 1998, the higher catches occur for period February, April, May and June, with maximum catches in May (2746 fishes) (Fig 2).
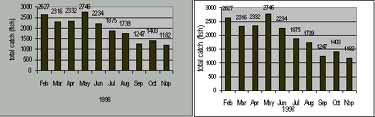
Fig. 2. Big eye monthly catches in the south Java seawaters in 1996 and 1998 respectively.
The monthly migratory pattern of big eye in Indian Ocean was deduced by use of 1967-1985 catch data of Japanese tuna long line fishery (Mohri et al., 1997). During the southern hemisphere winter season, from April to September, the big eye tuna are generally distributed in the high latitude area of Indian Ocean. However, some big eye tuna also occur in the waters north the Madagascar in June, and off Java in July.
The catches pattern of big eye in 1996 and 1998 (Fig. 3) in south Java seawaters is coincided with the study conducted by Mohri et. al, 1997, who found that the higher big eye catches occur for period of February, May, June and July.
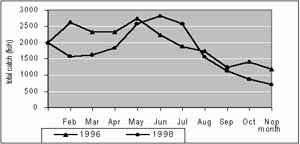
Fig. 3. The pattern tuna catch in the south Java seawater in 1996 and 1998.
4. Conclusion
Defining ENSO years as the years that fall in standard deviation of Southern Oscillation Index <= -1.5, the SST monthly mean in the south Java seawaters range from 25.9 to 27.1°C for non-ENSO year and 26.0°C to 28.5°C during the ENSO year.
Monthly mean SST value in the south Java seawaters ENSO years are lower than that of the non-ENSO year with the average different of 1.7°C.
Total tuna catch in 1996 and 1998 are 42,209 fishes 30,401 fishes respectively. Therefore, big eye tuna catch in ENSO year is higher than that non-ENSO year.
References
- Bigg, G. R. The Oceans and Climate. Cambridge University Press. Cambridge. 1996. 266p.
- Mizuno, K., 1995. Variabilities of Thermal and Velocity Field in the Vinicy of North of Australia Basin with Regard to the Indonesia Trough flow. In: Proceeding of International Workshop the Trough flow Studies in Around Indonesian Waters. BPPT. Indonesia.
- Mohri, M., E. Hanamoto, M. Nemoto, and S. Takeuchi, 1997. Fishing Season, Fishing Ground and Migratory Pattern of Big Eye Tuna in the Indian Ocean as Seen from Tuna Long Line Catches. In Japan Fisheries Bulletin, pp 1-5.
- Pariwono, J.I : Effect of El-Nino Southern Oscillation (ENSO) on Fish Catch in Indonesian. Bogor Agricultural University, pp. 20-25.
- Philander, S. G., 1990. El NIÑO, La Nina, and the Southern Oscillation. Academic Press, Inc. San Diego, pp. 12-25.
- Polis, G. A., S. D. Hurd, C. T. Jackson, and F. S. Pinero, 1997. El NIÑO Effects on the Dynamics and Controls of an Island Ecosystem in the Gulf of California. Ecology. Vol. 78. No.6. pp. 1884-1897.
- Quinn, W. H., V. T. Neal, and S. E. Antunez de Maloyo, 1987. El NIÑO Occurrences over the Past Four and Half Centuries. J. of. Geophys. Res. Vol. 92, pp. 14449-14461
- Trenberth, K. E., 1991. General Characteristics of El Nino-Southern Oscillation. In: Glantz, M. H., Katz, R. W., and Nicholls, N. (eds). Teleconnections Linking Worldwide Climate Anomalies. Cambridge University Press. Cambridge, pp.13-42.