| GISdevelopment.net ---> AARS ---> ACRS 2000 ---> Oceanography |
Sea surface temperature
variability in the seas surrounding The philippines in relation to ENSO
events
1Erlinda E.
Salamante and 2Cesar L. Villanoy
Marine Science Institute, University of the philippines Velasquez Street,
Diliman, Quezon City, philippines 1101
Tel no.: (63-2) 922-3944; Fax no.: (63-2) 922-3959
E-mail:1lindae@msi01.cs.upd.edu.ph; 2cesarv@msi01.cs.upd.edu.ph
Keywords:sea surface temperature, El Niño
Southern Oscillation (ENSO), Empirical Orthogonal Functions (EOF)
Marine Science Institute, University of the philippines Velasquez Street,
Diliman, Quezon City, philippines 1101
Tel no.: (63-2) 922-3944; Fax no.: (63-2) 922-3959
E-mail:1lindae@msi01.cs.upd.edu.ph; 2cesarv@msi01.cs.upd.edu.ph
Abstract
Sea surface temperature (SST) of the Philippine, Celebes, Sulu and South China Seas (SCS) was analyzed using time-domain Empirical Orthogonal Functions (EOF) to describe the spatial, temporal and interannual variability existing within the different basins. The satellite-derived monthly SST distributions were obtained from the Earth Observing System Data and Information System (EOSDIS) at the Jet Propulsion Laboratory (JPL). The SST images extracted were from September to August of the following years: 1991 to 1992, 1995 to 1996 and from 1997 to 1998. These data sets were used to represent weak ENSO, non-ENSO and strong ENSO, respectively. The first three EOF modes were compared to investigate the SST variability in relation to ENSO. For the first mode, the SST patterns during non-ENSO are similar with those of ENSO years, although the temperature difference, between the Philippine and the South China Seas, for the latter is smaller compared to the former. This mode shows that the advection of cold water from the north in the SCS weakens during strong ENSO. The Philippine Sea, on the other hand, is characterized by weak latitudinal temperature gradient and homogeneous warm water at the southern portion. The second mode exhibits strong interannual variations. The basin-wide circulation in the SCS during strong ENSO weakens and the cold upwelled water off Vietnam during normal year did not developed as ENSO occurs. The third mode is dominated by the interaction of the SCS water and the Pacific water west of Luzon strait.
Introduction
The ENSO event is one of the natural phenomenon which affects both regional and global climate. On the average this event occurs about once every 3 to 4 years. It typically lasts from 1 to 1.5 years and is known to be accompanied by an interannual see-saw in the tropical sea level pressure between the eastern and western hemispheres called the Southern Oscillation (Thurman, 1998a).
Though it is already a common notion that SST during ENSO is measurably higher in the Equatorial Eastern Pacific than normal, many aspects of the oceanic changes considerably vary in every occurrence of this event. Much research and analyses are needed to explore and adequately understand the possible dominant physical processes at work during the various phases of ENSO. This study explores the possible influence of this phenomenon to the SST variability within the Philippine, Celebes and Sulu seas as well as in the SCS.
Methods
The satellite images of monthly-derived SST were downloaded from the NOAA/ NASA AVHRR Ocean Pathfinder SST website (http://www.podaac.jpl.nasa.gov/sst). The images downloaded were from 1988 to 1998, but only those years with almost continuous monthly data were included (i.e. January 1991 to November 1993 and January 1995 to August 1998), three years worth of monthly SST data representing weak ENSO, non-ENSO and strong ENSO conditions were selected based on the Southern Oscillation Index (SOI) for 1991 to 1998. The SST images extracted were from September to August of the following years: 1991 to 1992, 1995 to 1996 and from 1997 to 1998, respectively.
Each monthly image extracted has a spatial resolution of 9 km x 9 km and represents monthly averaged SST data. The missing values were interpolated using weighted fill method . The mean for each month was calculated and used as reference to derive the monthly SST anomaly fields. The output generated was then decomposed in terms of orthogonal functions to describe the spatial and temporal variability, utilizing EOF in a time domain application. The EOF computation/ analysis was done using the scatter matrix method (Emery and Thomson, 1997b).
Discussion of Results and Findings
Monthly mean SST images
The SST variations in the SCS during non-ENSO are primarily influenced by the monsoon and surface current circulation. The Pacific, on the other hand, is generally affected by a complex near-surface wind-driven circulation (Kendall, 1989 as cited by Masumoto et al., 1991c). These major forces, which drive the circulation of the SCS and the Pacific, as well as dominant mechanisms, which influence the SST per se, are the significant aspects that should be considered in analysing the effect of ENSO. Moreover, determining the cause of this phenomenon also entails the identification of certain mechanisms that are consistent with the vast quantity of evidence of the oceanographic and meteorological changes coincident with this event.
The SST images exhibit distinct seasonal variation. During winter, the SST variations with weak and non-ENSO events are similar, and the SCS is dominated by cooler temperature to the north and northwest against warmer temperatures to the south and southeast. The intrusion of cold water from the north expands southward against the diminishing warm water in October, reaching its maximum dispersion off Vietnam in February. After this month, the inflow of warm water from the southern extremities starts to cover a greater part of the SCS and the southern portion of the Philippine Sea. By July, the cold water is completely eroded and the entire basins are completely covered with warm water. During this month, maximum SST in the SCS is higher by 0.4°C during non-ENSO compared with weak ENSO, while the minimum temperature in the Philippine Sea during weak ENSO is recorded to be lower by 1.4°C compared with non-ENSO year. The low SST to the north and west is largely induced by evaporation associated with the strong northeasterly wind (Chao et al., 1996d).
The northeast monsoon weakens from February to March. As of April, weak transition from cold to warm water starts to prevail within the whole basin. Higher temperatures covered a greater part of the SCS and the Philippine Sea with temperatures as high as 32.85°C recorded for the month of July at the northwestern part of Luzon, compared with non-ENSO. A weaker and more southerly southwest monsoon, from June to August, can highly be attributed to the eastward wind stress anomalies associated with a weak northerly component (Chao et al., 1996d).
Sea surface temperature within the Sulu and Celebes Seas obtained from the satellite images, only show a handful of distinct variations as well as significant similarities during normal and ENSO years. The surface temperature within the former basin is estimated to reach only as high as 26°C up to 30°C, during non-ENSO. The same minimum temperature exists during weak ENSO but the water is much warmer by 1°C. During ENSO event, the estimated temperature ranges from 27°C to 31°C. The maximum temperature, during non-and weak ENSO is observed in May, but with strong ENSO it dominates the basin only after two months. On the other hand, surface temperature in the Celebes Sea only ranges from 29°C up to 30°C for the three given conditions, all throughout the year.
EOF Analysis
The EOF decomposition of SST data, for the three ENSO phases, yields three dominant modes. On the average, the three modes accounted 71%, 7% and 5% of the total variations, respectively.
The first mode, shows typical spatial pattern associated with the monsoon. It is dominated by the intrusion of cold water from the northeast that reaches southward off the southern coast of Vietnam: (~9°N) during non-ENSO, north of 14°N during weak ENSO and north of 23°N during ENSO. The Philippine Sea is characterized by weak latitudinal temperature gradient and homogeneous warm water at the southern portion up to 18°N. The amplitudes of the first mode, which is identical for the three data sets, are characterizes by almost uniform positive values throughout the year - weakening during southwest monsoon months (i.e. from June to September).
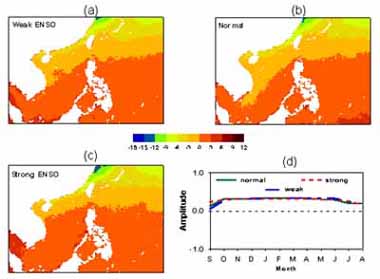
Figure 1. Spatial distributions (a, b and c) and seasonal amplitudes (d) of the 1st EOF mode.
For the three periods considered, the first mode, shows typical spatial pattern associated with the monsoon. With or without ENSO, for both the SCS and the Philippine Sea, there exists a north to south temperature gradient - with a decreasing temperature from the north. The weaker signal given during the southwest monsoon suggests that the north to south gradient pattern (which is very prominent during the northeast monsoon) diminish with the onset of this season. Reduced inflow of cold water in the northern extremities, during strong ENSO, can be associated to the anomalous southerlies or southwesterlies in the SCS during ENSO, which opposes the mean wintertime northeasterly flow that advects cold and dry air off the Asian continent (Klein et al., 1999e). This eventually lead to the reduction in the wind speed and occurrence of cold-air outbreaks, for that reason, the latent and sensible heat flux in the northern portion of the SCS as well as in regions northeast of the philippines were also reduced.
The second mode exhibits strong interannual variations. The spatial variability of temperature in the Philippine Sea is smaller during period of non-ENSO compared with ENSO years. The basin-wide circulation in the SCS during strong ENSO, on the other hand, seems to weaken as the temperature difference between the northern and southern portion of the basin is very distinct. The cold upwelled water off Vietnam during normal year did not also developed as ENSO occurs. Its monthly amplitudes during non-ENSO, are symmetrical with the seasonal variations. However, periods with weak and strong ENSO indicate a reversal of the amplitude values as compared with non-ENSO. Period with weak ENSO also shows the same temporal variability as that of strong ENSO, however the negative amplitude only extended up to October. The negative amplitude and the negative anomalies in the northern part of the SCS and Philippine Sea, during strong ENSO, can be associated to the weak transition of northeast monsoon (Wu et al., 1998f).
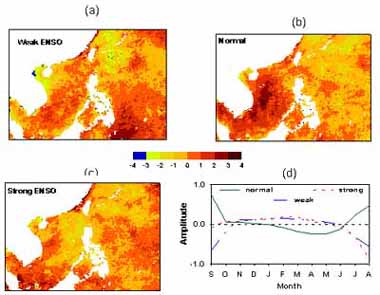
Figure 2. Spatial distributions (a, b and c) and seasonal amplitudes (d) of the 2nd EOF mode.
The third mode highlights the formation of a warm/ cool pool in the northwestern part of Luzon (centered at 16.4°N, 118.3°E) during strong ENSO. This spatial pattern may already be affected by noise due to some undefined patterns, particularly during weak ENSO. The feasible reason behind the formation of warm water on this area, during strong ENSO, is quite hard to define. Whether this feature was caused by the occurrence of ENSO or by processes of a large-scale origin, requires further investigation. In terms of its amplitude, this mode only shows one significant feature during non-ENSO, which is the appearance of the extreme negative amplitude in July. This features may be an indication of a northeastward warm current off the southern coast of China (Chao et al., 1995g) during winter.
The results of the EOF analysis within the Sulu Sea and Celebes Sea are not that distinct compared with the SCS and the Philippine Sea. Since the two basins are partly bounded by land, land masking highly influences the result of the analysis. Though the spatial and temporal patterns in these two regions are quite hard to define, the characteristics of their surface temperature can still be compared based on the satellite images. Surface temperature in the Sulu Sea is much warmer compared to the Celebes Sea since the primary source of the water in the former basin comes from the SCS while the latter is primarily influence by the Mindanao current. And in general, since the water in the SCS is distinctly colder than the Pacific (Shaw, 1991h), it is expected that water in the Sulu Sea is colder than the Celebes Sea.
Summary and Conclusion
The seasonal, temporal and internannual variations of sea surface temperature, highlighting its association to the ENSO event, in the water surrounding the philippines was examined by performing an EOF analysis. Satellite-derived monthly SST images of the area were used as the principal basis. The images were classified into three periods, representing specific year with strong, weak and non-ENSO. Results from the first three EOF modes reflect various significant characteristics linking the SST variations to the ENSO event, such as reduced inflow of cold water in the northern extremities, reduced upwelling and weak seasonal variation. It was also observed that the dominant spatial pattern in the South China Sea can be associated with the northeast monsoon. Distinct latitudinal difference exists in the Philippine Sea with or without ENSO. Lastly, sudden change in the prevailing local wind system in the SCS during ENSO primarily affects the circulation in the basin and results in the warming of the upper ocean.
References
- Chao, S. Y., P. T. Shaw, and J. Wang, 1995g. Wind Relaxation as a Possible Cause of the South China Sea Warm Current. J. Oceanography, 51, pp. 111-132.
- Chao, S. Y., P.T. Shaw, and S.Y. Wu, 1996d. El Niño Modulation of the South China Sea Circulation. Prog. Oceanog., 38, pp.51-93.
- Emery, W. J. and R. E. Thomson, 1997b. Data Analysis Methods in Physical Oceanography. Gray Publishing, Tunbridge Wells, Kent, pp.319-340.
- Klein, S.A., B.J. Soden. and N.C. Lau, 1999e. Remote Sea Surface Temperature Variations during ENSO: Evidence for a Tropical Atmospheric Bridge. J. Climate, 12, pp. 917-932.
- Masumoto, Y. and T. Yamagata, 1991c. Response of the Western Tropical Pacific to the Asian Winter Monsoon: The Generation of Mindanao Dome. J. Phys. Oceanogr., 21, pp.1386-1398.
- Shaw, P.T., 1991h. The seasonal variation of the intrusion of the Philippine Sea water into the South China Sea. J. Geophys. Res., 96, pp. 821-827.
- Thurman, H. V., 1998a: Introductory Oceanography, 7th. Ed. Macmillan Publishing Company, New York, pp.185-212.
- Wu, C.R., P.T. Shaw and S.Y. Chao, 1998f. Seasonal and interannual variations in the velocity field of the South China Sea. J. Oceanogr., 54, pp. 361-372.