| GISdevelopment.net ---> AARS ---> ACRS 2000 ---> Mapping from Space & GPS |
Effect of coherence on dems
derived from sar interferometry: A case study of mayon volcano,
philippines
Vu Tuong Thuy and Mitsuharu
Tokunaga
Space Technology Applications and Research Program
Asian Institute of Technology
P.O. Box 4 Klong Luang, Pathumthani, 12120, Thailand
Tel: +66-2-5245577 or +66-2-5245690 Fax: +66-2-5245597
Email: rsc009994@ait.ac.th , tokunaga@ait.ac.th
THAILAND
Keywords : SAR Interferometry, DEM, phase
coherenceSpace Technology Applications and Research Program
Asian Institute of Technology
P.O. Box 4 Klong Luang, Pathumthani, 12120, Thailand
Tel: +66-2-5245577 or +66-2-5245690 Fax: +66-2-5245597
Email: rsc009994@ait.ac.th , tokunaga@ait.ac.th
THAILAND
ABSTRACT :
Synthetic Aperture Radar (SAR) Interferometry is a technique for obtaining the Digital Elevation Model (DEM) of the Earth surface by processing the phase difference between coincidence SAR images. Nowadays, SAR interferometry is considered as the promising technique for obtaining high resolution and quickly updated DEM. Here we present two experiments that make use of ERS1&2 Tandem data for making DEM derived from SAR Inteferometry. As the results, we show the limitation of the length of baseline for C band data, the correlation of DEM accuracy with coherence, and the correlation of DEM accuracy with NDVI.
1. Introduction
Recent years, Synthetic Aperture Radar (SAR) Interferometry has been utilized as a potential technique for obtaining accurate DEM of the Earth surface. The SAR interferometry products are becoming familiar to the applications and researches. SAR interferometry is based on the processing the phase difference between coincident SAR images. The displacement vector between two antennas is called baseline vector. Two antennas may be mounted on one aircraft and form along-track interferometry or across-track interferometry. The other way utilized in this research is repeat-pass interferometry, which is the normal implementation for satellite. If the ground objects still keep the high correlation between two times of illumination, the spatial baseline can be synthesized.
There have been several researches (Wehr A., et al., 1996, and Zebker H.A., et al., 1994) pointing out some results of the effect of phase coherence on DEM accuracy as well as analysis and utilizing of phase coherence. However, there is no any this kind of result for Southeast Asian tropical region. In this paper, besides the utilizing ERS1&2 data for investigating effect of phase coherence on DEM of Mayon volcano, we investigated the relationship between phase coherence and land cover.
2. Methodology
|
|
|
|
|
|
|
|
|
|
|
|
|
|
|
|
|
|
|
|
In general, the processing can be separated into three parts as below:
2.1 Making DEM
First, two single-complex images were coregistrated together. After coregistrating two images and resampling one to other, the complex inteferogram was calculated by using the following equation:
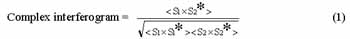
where s1 and s2 are single look complex values of two coregistered images,
* stands for conjugate complex,
<> stands for ensemble average
A portion of interferometric phase that are affected by the orbital fringe should be removed out of interferogram based on perpendicular component of baseline, then flattened inteferogram was formed. Along with this processing, coherence coefficient also was estimated.
Before doing phase unwrapping, the interferogram was filtered to reduce phase noise. Then, phase unwrapping was done following region-growing method. The low correlation area, layover area and neutral trees that were formed by the connection of residues were masked to avoid in phase unwrapping.
Here, GCPs were extracted from DEM derived from topographic map (DEMtopo) to precisely estimate baseline geometry, so it is necessary to coregistration between DEMtopo and SAR image. The automatically registration method is based on the cross-correlation between SAR image and simulated SAR image from DEMtopo.
Based on the extracted GCPs above, least squared method was used to precisely estimate baseline geometry.
Now, we can calculate the elevetion from unwrapped phase
The equations used are listed as follow:
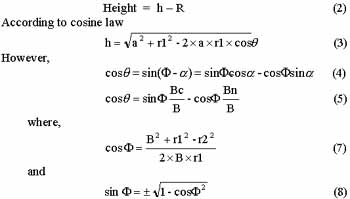
B, Bc, Bn, r1 and r2 (see Figure 1) are known values.
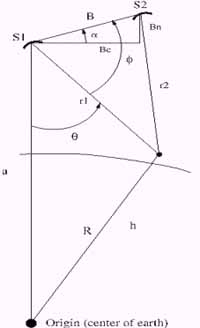 |
r1 r2 h a R S1 S2 Bc,Bn a f q |
Baseline
Magnitude Reference slant-range Second slant-range Ground radial distance Satellite radial distance Center scene geocentric radius Reference satellite Second satellite Baseline cross-track and normal component Baseline orientation |
Figure 1 - Interferometric geometry for calculation
2.2 Investigating the effect of phase coherence on DEM accuracy
DEM derived from SAR interferometry above (DEMInSAR) was compared to DEMtopo with respect to the changes of coherence coefficient. Two-steps investigation was done. First, the profiles were taken from two DEMs and coherence image to give a figure of the trend. Then, coherence value was grouped with the interval of 0.01. With each group, the standard deviation of height difference was calculated. Last, we drew the graph of the relationship between coherence value and this standard deviation value.
2.3 Investigating the relationship between phase coherence and land cover type.
From geocoded Landsat TM images, Normalized Difference Vegetation Index (NDVI) was calculated. Like the above investigating, NDVI was grouped with the interval of 0.01. Then, the trend of coherence with respect to NDVI was investigated.
3. Results And Discussion
3.1 Study area
Mayon volcano is located in the Alabay province of Philippines, 300 km SE of Manila (13°15.4'N - 123°41.1'E). The summit is about 2460 meters above sea level and base circumference is 62.8 km, encompassing the towns of Camalig, Malilipot and Sto. Domingo. Mayon has the classic conical shape of a stratovolcano. It is the most active volcano in the Philippines. The latest eruption is in February 2000 and on going.
3.2 Data processing
As mentioned above, two SAR data sets were used. The result and discussion here are demonstrated following the step in Method part.
The flattened interferograms are shown in Figure 2. In 1997 data, the fringe only appears in some area in the foothill of Mayon and completely disappears in the steep slope area. With 1996 data, the result is better and we can recognize that the fringe is worse in layover area. The estimated baseline of two data sets is introduced in Table 2.
| Data | T | C | N | Length |
| 1996 baseline (TCN) (m) | 0 | -86.07 | 32.28 | 91.93 |
| 1997 baseline (TCN) (m) | 0 | 393.98 | 53.97 | 397.66 |
Let us consider coherence coefficient. The coherence images are depicted in Figure 3. Compare between Figure 2 and Figure 3, we know that the higher coherence coefficient, the clearer fringe.
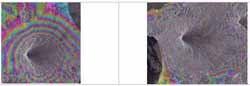
Figure 2 - Flattened interferogram of 1996 data (left) and 1997 data (right)
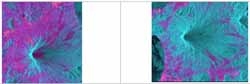
Figure 3 - Coherence image of 1996 data (left) and 1997 data (right)
As mentioned above, region-growing algorithm was used for phase unwrapping. We have done successfully with 1996 data, but failed when trying 1997 data. The reason is that the high phase noise in 1997 interferogram. Therefore, only 1996 data was used to make DEM and compared to DEMtopo.
After automatically coregistration between DEMtopo and SAR by cross-correlation analysis, a number of GCPs was extracted for precise estimation of baseline geometry. The slant-range and ground-range elevation image are shown in Figure 4. It is noted that DEMtopo should be masked with DEMInSAR to eliminate these no-information areas in comparison.
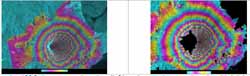
Figure 4 - 1996 slant-range elevation (left) and ground-range elevation (right) images
Here, by taking profile in DEMtopo, DEMInSAR and coherence images, we want to check the effect of coherence on the height difference. The result is illustrated in Figure 5. On the left side, i.e. high coherence value, two profile curves from DEMInSAR and DEMtopo are nearly coincident. On the other side, i.e. layover area with low coherence value, the profiles show the bigger differences. Then, the comparison was done more statistically. The distribution of coherence values in both data sets is illustrated in Table 3. Both data sets introduce low coherence value.
| Data | Min | Max | Mean | Stdev |
| 1996 | 0.01 | 0.87 | 0.365 | 0.142 |
| 1997 | 0.01 | 0.85 | 0.255 | 0.138 |
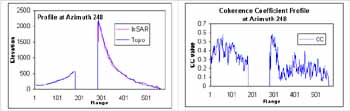
Figure 5 - Illustration of profile taken at azimuth 248Comparison of DEMInSAR and DEMtopo (left); Coherence (right)
In Figure 6 (left), we can see that when coherence value increases, the standard deviation of height difference between two DEMs decreases quickly. This trend follows exponential function.
There are many factors that affect on phase coherence. Here, we consider in land cover. We have already known that when land cover changes with the time, the coherence has the trend of decreasing. The correlation analysis between 1996 coherence, 1997 coherence and NDVI (see Table 4) shows that it is also correct here. The graph shown the trend of coherence coefficient against NDVI can be seen in Figure 6 (right).
|
|
|
|
|
|
|
|
|
|
As we knew, SAR ERS1&2 data with C band and VV polarization weakly interacts to vegetation. The results from this research introduce some interesting further researches in this point.
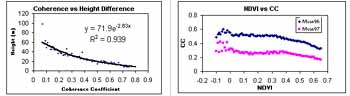
Figure 6 - Relationship between coherence and DEM accuracy (left)Relationship between NDVI and coherence (right)
4. Conclusion
In this paper, ERS1&2 tandem data was used for applying of SAR interferometry in tropical Asian region. The result shows very low coherence value. However, by using 1996 data, we can make DEM using SAR interferometry. In conclusion, DEM accuracy decreases following the exponential function when coherence value increases. In addition, this paper also concluded that the coherence coefficient decreases when NDVI increases.
From this study, the results can be used for the further researches either in application site or in technique site. Phase coherence is very important in SAR interferometry research. This kind of research should be conducted for Southeast Asian region.
5. References
- Gens, R., Van Genderen, J.L., 1996. Review Articles SAR interferometry: issues, techniques, applications. Int. J. Remote Sensing, 17 (10), pp. 1803-1835.
- Kenyi, L., Raggam, H., 1996. Accuracy assessment of Interferometrically derived DTMs. Fringe 1996.
- Qian, Lin, Vesecky, F.J., Zebker, H.A., 1994. Comparison of elevation derived from InSAR data with DEM over large relief terrain. Int. J. Remote Sensing, 15, pp. 1775-1790.
- Madsen, S.N, Zebker, H.A., Martin, J.M., 1993. Topographic Mapping Using Radar Interferometry: Processing Techniques. IEEE Trans. GE and RS, 31 (1), pp. 246-256.
- Seymor, M. S., 1999. Refining Low-Quality Digital Elevation Models Using Synthetic Aperture Radar. Doctoral Thesis, University of British Columbia, Canada.
- Wehr, A., et al., 1996. The effects of different land covers on the accuracy of interferometric DEM. Fringe 1996.
- Zebker, H.A., Werner, C., Rosen, P.A., Hensley, S., 1994. Accuracy of Topographic Maps Derived from ERS-1 Interferometric Radar. IEEE Trans. GE and RS, 32 (4), pp. 823-836.
- Zebker, H.A., Villasenor, J., 1992. Decorrelation in Interferometric Radar Echoes. IEEE Trans. GE and RS, 30 (5), pp. 950-959.
- Final Report, 1999. Remote Sensing and GIS analysis for base data creation and change detection; the study on comprehensive disaster prevention around Mayon volcano in the Republic of The Philippines. (Source Asian Center for Research on Remote Sensing)