| GISdevelopment.net ---> AARS ---> ACRS 2000 ---> Landuse |
Additional Nighttime Avhrr
Data for Classifying Land Cover Types in Thailand
Chada Narongrit(1), Mitsuharu Tokunaga, Shunji Murai, Kaew Nualchawee, Apisit Eiumnoh, Suphat Vongvisessomjai
Space Technology Applications and Research (STAR) Program, School of Advanced Technologies,
Asian Institute of Technology, P.O. Box 4, Klong Luang, Pathumthani 12120, Thailand
E-MAIL(1) : chadan@nu.ac.th
Keywords: Nighttime NOAA-AVHRR, Land Cover Type
Classification
Abstract
Nowadays, land-cover type classification using only daytime AVHRR data is limited by accuracy and number of land cover classes. The new method developed in this study is to investigate nighttime AVHRR data as an additional band for classifying land cover types with respect to improve accuracy and specify more land cover classes. The classification accuracies of various band combinations, NDVI, ordinary brightness temperatures and/or land surface temperature (LST), were comparatively assessed. Both in cool and hot seasons, overall accuracies using combination between day and night time data show better than using only daytime data. The combination of three bands of NDVI, daytime LST, and nighttime LST shows the highest accuracy. Three-band combination using only daytime shows lower accuracy than two bands using day and nighttime. Adding nighttime data obviously increases the accuracies of forest and built up classes. The nighttime data can well discriminate forest from active agriculture (or mature crops), deciduous forest in hot season from inactive agriculture (or non-mature crops), and built up from harvested or fellow agriculture. The results indicate that this approach using nighttime data behaved well as a new method for classifying land cover types at the landscape scale using AVHRR low-resolution data.
1. Introduction Recently, many practical satellites have been increased to monitor land cover information around the globe. The use of high-resolution satellite data, for example, derived from Landsat-TM, and SPOT have suffered from the infrequent coverage, high data volume and high costs. Thus, recent efforts have been directed toward the use of low-resolution data (1.1 km at nadir) obtained by NOAA AVHRR sensor that provides much better temporal resolution with daily coverage (Cihlar, Ly and Xiao, 1996). For this coarser AVHRR data, a main problem is pixels containing a mixture of land cover types. The supplementation of high-resolution image is generally used to overcome this problem but this is cost consumption. Thus, the methodological challenge is to extract meaningful land cover information by using only AVHRR data. For land cover type classification, vegetation index, computed as the pixel difference between AVHRR channels 1 and 2 reflectance divided by the sum of the two channels, is firstly used. The thermal infrared data is subsequently used. More recent research use the combination among NDVI, thermal, and ratio between these two variables. However, most of these works use only thermal data in daytime while the AVHRR sensor provides daily useful data both in day and night times. The land cover types and land characteristics can be specified by temperature difference over a time or can be described by thermal inertia, a physical variable describing the impedance to variations of temperature. High thermal inertia values lead to small changes in temperature, for a given transfer of heat (Xue and Cracknell, 1995). Water resist to the change of temperature through a time compared with other surface types. The fractional vegetation cover increases, surface temperature in daytime and temperature difference between daytime and nighttime decreases (Lambin and Ehrlich, 1997).
This study does not intend to produce a definitive land cover map, but rather attempt to investigate various band combinations of day and night time AVHRR data that can be the greatest possibility for classifying land cover types. The innovation of this research is to use nighttime AVHRR data as an additional band with respect to improve classification accuracy of land cover types derived from the AVHRR coarse resolution data.
2. Data and Method
The AVHRR images derived from the NOAA-14 passes at around 2 AM and 2 PM were selected from least cloud 3-continuous days in December 1997 (cool season) and March 1998 (hot season). Prior to image classification, the images were subjected firstly to geo-reference correction. Secondly, the images of NDVI and land surface temperature (LST) were generated. The adjusted LST equation using the split window technique (Kremer and Running, (1993), Deschamps and Phulpin (1980)) and NDVI equation in this study show as follows:
NDVI = (band 2-band 1)/ (band 2+band 1)
LST = band 4 +1.11 (band 4-band 5) -273, (Chada, 2000)
Thirdly, The composite images of AVHRR bands 3, 4, 5, LST and NDVI were generated using maximum values. Only the NDVI images were derived from daytime data. Others were retrieved from both daytime and nighttime data. Forth, cloud remaining in MVC LST images was masked on pixels with less than 13 degree Celsius and with temperature difference between day and night less than 0 and greater than 20 degree Celsius. Next, all corrected composite images were re-scaled from 0 to 100 by relative equation:
Finally, the Maximum Likelihood classification method was used. The transected training sites or ROI (region of interest) were randomly sampled based on the overlaid digitized land use map and supplemented by recent land cover types interpreted from NDVI and temperature profiles taken from the images. At least two trainning sites and more than 150 pixels per site were labelled for seven main classes: Water bodies (Wt): The dam and reservoir covered by water. Built up areas (Bu): The urban lands have least vegetation covered. Field crops (Cr): The vegetated areas grown for annual crops such as cassava, sugar cane, maize, and mixed field crops. Paddy fields (Pa, Ph, and Pu): The vegetated areas cultivated for rice crops. This class was labeled into three subclasses: lowland active paddy (Pa) and lowland harvested paddy (Ph) and upland paddy (Pu). Orchards (Or): The vegetated lands grown for fruit trees. Para rubber (Rb): The lands planted for para rubber tree. Forests (Fe, Fd): This class was labeled into two subclasses: (1) deciduous forest (Fd), the vegetative areas mostly covered by deciduous forest that somewhere mixed with the sparse evergreen forest, dry dipterocarp forest, plantation forest and disturbed forest, and (2) evergreen forest (Fe), the vegetated areas permanently covered by high density of evergreen forest.
The classified images were overlaid with the existing land use map in 1995 of Thailand classified from Landsat-TM to compute their overall accuracy (OAE, personal contact).
3. Results and Discussions
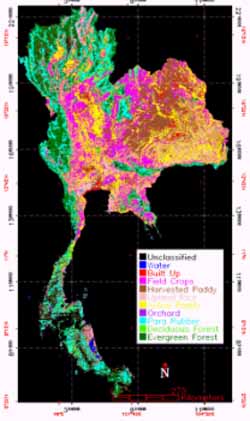
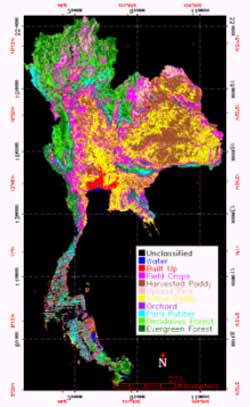
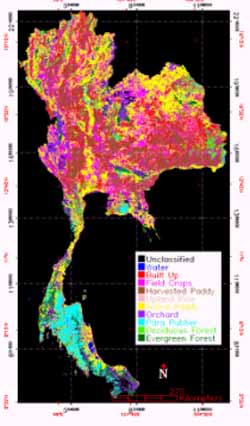
For classified images in cool season (Figure 1), the overall accuracy assessed by the existing land use maps in 1995 were 80.64% for only daytime LST and 83.78% for combination of daytme LST (LSTd) and nighttime LST (LSTn), increased 3%. For classified images in hot season (Figure 2), the overall accuracy were 75.35% for only daytime LST and 79.40 % for combination between day and nighttime LST, increased 4%. Using only daytime data of NDVI and LSTd, Built up areas (Ba) and harvested paddy (Ph) cannot be separated. Ph in northeastern part of Thailand was mis-classified as Ba, particularly in hot season. Evergreen forest (Fe) in hot season was mis-classified as orchard (Or) and active paddy (Pa). These misclassifications were be corrected by using a combination of day and nighttime data. Because field crop (Cr) in hot season was in early planting or in harvesting period, thus, it was mis-classified as harvested paddy (Ph) and deciduous forest (Fd). The analysis between LST and two environmental factors, NDVI and elevation showed that LSTd was stronger correlated with NDVI than elevation while LSTn was fairly correlated with both NDVI and elevation (Chada, 2000). Thus, in case of Fd, its LSTd and NDVI were similarly with Cr, Ba, and Ph but its LSTn was remarkably lower than such land cover types because Fd situated on high elevation. Including channel 3 in the classifications gave good accuracy. As shown in Figure 3, the accuracy of three bands of daytime such as NDVI, band 3 and LST (81.61% in cool and 77.87% in hot season) was lower than of two bands of day and nighttime combinations such as NDVI and nighttime band 3 (82.43% in cool and 78.96% in hot), NDVI and nighttime LST (83.62% in cool and 79.85% in hot). These indicated that the accuracy was not improved by number of band but was improved by nighttime data.
The confused analysis of 7 main classes showed in Figure 4. In both cool and hot seasons, the accuracies of built up and forest were obviously increased using the combination between NDVI and LSTn. The best accuracy was obtained from paddy class. From the results, it should be explained that:
The new method by adding nighttime data was effective to classify land cover types by improving classification accuracy, particularly of forest, paddy and built up classes. Nighttime LST can well distinguish built up from harvested land, active paddy from active filed crop or perennial crop, and forest from active paddy and lowland tree. This indicates that nighttime data can be feasibly used to classify topographically related land cover types.
Acknowledgment
The authors wish to express appreciation to Dr. Kiyoshi HONDA, director of ACRoRS, for contributing the AVHRR images, and to Dr. Surat Lertlum, senior researcher of ACRoRS, for his helpful knowledge in NOAA-AVHRR processing. The author sincere thanks to Dr. Supan Karnchanasutham, head of Center for Agricultural Information, for his providing the updated land use map of Thailand.
ReferencesDay
Night
Day and Night
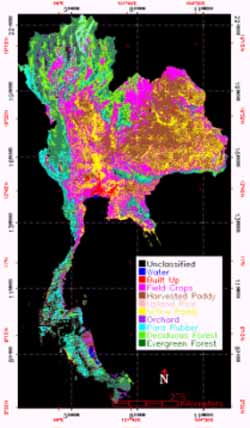
Figure 1 Classified Images in Cool Season
Day
Night
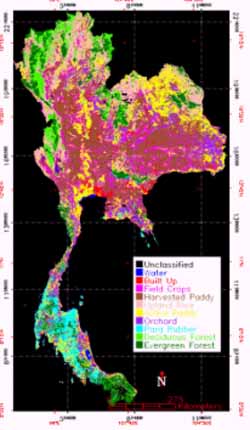
Day and Night
Figure 2 Classified Images in Hot Season
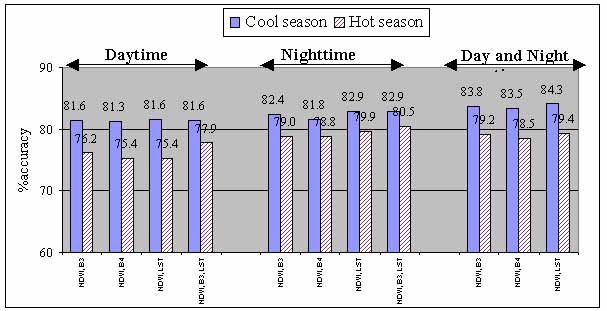
Figure 3 Comparative Accuracy of Input Bands in Hot and Cool Seasons
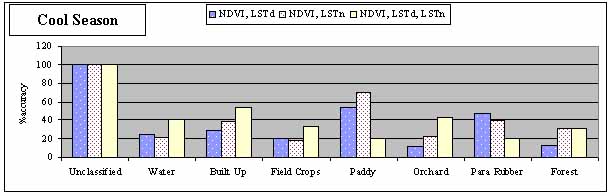
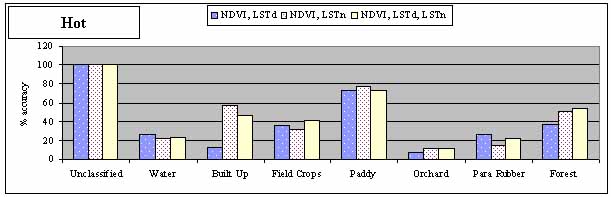
Figure 4 Accuracy Comparisons for Each Main Land Cover Types By Using Different Input Bands
Abstract
Nowadays, land-cover type classification using only daytime AVHRR data is limited by accuracy and number of land cover classes. The new method developed in this study is to investigate nighttime AVHRR data as an additional band for classifying land cover types with respect to improve accuracy and specify more land cover classes. The classification accuracies of various band combinations, NDVI, ordinary brightness temperatures and/or land surface temperature (LST), were comparatively assessed. Both in cool and hot seasons, overall accuracies using combination between day and night time data show better than using only daytime data. The combination of three bands of NDVI, daytime LST, and nighttime LST shows the highest accuracy. Three-band combination using only daytime shows lower accuracy than two bands using day and nighttime. Adding nighttime data obviously increases the accuracies of forest and built up classes. The nighttime data can well discriminate forest from active agriculture (or mature crops), deciduous forest in hot season from inactive agriculture (or non-mature crops), and built up from harvested or fellow agriculture. The results indicate that this approach using nighttime data behaved well as a new method for classifying land cover types at the landscape scale using AVHRR low-resolution data.
1. Introduction Recently, many practical satellites have been increased to monitor land cover information around the globe. The use of high-resolution satellite data, for example, derived from Landsat-TM, and SPOT have suffered from the infrequent coverage, high data volume and high costs. Thus, recent efforts have been directed toward the use of low-resolution data (1.1 km at nadir) obtained by NOAA AVHRR sensor that provides much better temporal resolution with daily coverage (Cihlar, Ly and Xiao, 1996). For this coarser AVHRR data, a main problem is pixels containing a mixture of land cover types. The supplementation of high-resolution image is generally used to overcome this problem but this is cost consumption. Thus, the methodological challenge is to extract meaningful land cover information by using only AVHRR data. For land cover type classification, vegetation index, computed as the pixel difference between AVHRR channels 1 and 2 reflectance divided by the sum of the two channels, is firstly used. The thermal infrared data is subsequently used. More recent research use the combination among NDVI, thermal, and ratio between these two variables. However, most of these works use only thermal data in daytime while the AVHRR sensor provides daily useful data both in day and night times. The land cover types and land characteristics can be specified by temperature difference over a time or can be described by thermal inertia, a physical variable describing the impedance to variations of temperature. High thermal inertia values lead to small changes in temperature, for a given transfer of heat (Xue and Cracknell, 1995). Water resist to the change of temperature through a time compared with other surface types. The fractional vegetation cover increases, surface temperature in daytime and temperature difference between daytime and nighttime decreases (Lambin and Ehrlich, 1997).
This study does not intend to produce a definitive land cover map, but rather attempt to investigate various band combinations of day and night time AVHRR data that can be the greatest possibility for classifying land cover types. The innovation of this research is to use nighttime AVHRR data as an additional band with respect to improve classification accuracy of land cover types derived from the AVHRR coarse resolution data.
2. Data and Method
The AVHRR images derived from the NOAA-14 passes at around 2 AM and 2 PM were selected from least cloud 3-continuous days in December 1997 (cool season) and March 1998 (hot season). Prior to image classification, the images were subjected firstly to geo-reference correction. Secondly, the images of NDVI and land surface temperature (LST) were generated. The adjusted LST equation using the split window technique (Kremer and Running, (1993), Deschamps and Phulpin (1980)) and NDVI equation in this study show as follows:
LST = band 4 +1.11 (band 4-band 5) -273, (Chada, 2000)
Thirdly, The composite images of AVHRR bands 3, 4, 5, LST and NDVI were generated using maximum values. Only the NDVI images were derived from daytime data. Others were retrieved from both daytime and nighttime data. Forth, cloud remaining in MVC LST images was masked on pixels with less than 13 degree Celsius and with temperature difference between day and night less than 0 and greater than 20 degree Celsius. Next, all corrected composite images were re-scaled from 0 to 100 by relative equation:
Finally, the Maximum Likelihood classification method was used. The transected training sites or ROI (region of interest) were randomly sampled based on the overlaid digitized land use map and supplemented by recent land cover types interpreted from NDVI and temperature profiles taken from the images. At least two trainning sites and more than 150 pixels per site were labelled for seven main classes: Water bodies (Wt): The dam and reservoir covered by water. Built up areas (Bu): The urban lands have least vegetation covered. Field crops (Cr): The vegetated areas grown for annual crops such as cassava, sugar cane, maize, and mixed field crops. Paddy fields (Pa, Ph, and Pu): The vegetated areas cultivated for rice crops. This class was labeled into three subclasses: lowland active paddy (Pa) and lowland harvested paddy (Ph) and upland paddy (Pu). Orchards (Or): The vegetated lands grown for fruit trees. Para rubber (Rb): The lands planted for para rubber tree. Forests (Fe, Fd): This class was labeled into two subclasses: (1) deciduous forest (Fd), the vegetative areas mostly covered by deciduous forest that somewhere mixed with the sparse evergreen forest, dry dipterocarp forest, plantation forest and disturbed forest, and (2) evergreen forest (Fe), the vegetated areas permanently covered by high density of evergreen forest.
The classified images were overlaid with the existing land use map in 1995 of Thailand classified from Landsat-TM to compute their overall accuracy (OAE, personal contact).
3. Results and Discussions
For classified images in cool season (Figure 1), the overall accuracy assessed by the existing land use maps in 1995 were 80.64% for only daytime LST and 83.78% for combination of daytme LST (LSTd) and nighttime LST (LSTn), increased 3%. For classified images in hot season (Figure 2), the overall accuracy were 75.35% for only daytime LST and 79.40 % for combination between day and nighttime LST, increased 4%. Using only daytime data of NDVI and LSTd, Built up areas (Ba) and harvested paddy (Ph) cannot be separated. Ph in northeastern part of Thailand was mis-classified as Ba, particularly in hot season. Evergreen forest (Fe) in hot season was mis-classified as orchard (Or) and active paddy (Pa). These misclassifications were be corrected by using a combination of day and nighttime data. Because field crop (Cr) in hot season was in early planting or in harvesting period, thus, it was mis-classified as harvested paddy (Ph) and deciduous forest (Fd). The analysis between LST and two environmental factors, NDVI and elevation showed that LSTd was stronger correlated with NDVI than elevation while LSTn was fairly correlated with both NDVI and elevation (Chada, 2000). Thus, in case of Fd, its LSTd and NDVI were similarly with Cr, Ba, and Ph but its LSTn was remarkably lower than such land cover types because Fd situated on high elevation. Including channel 3 in the classifications gave good accuracy. As shown in Figure 3, the accuracy of three bands of daytime such as NDVI, band 3 and LST (81.61% in cool and 77.87% in hot season) was lower than of two bands of day and nighttime combinations such as NDVI and nighttime band 3 (82.43% in cool and 78.96% in hot), NDVI and nighttime LST (83.62% in cool and 79.85% in hot). These indicated that the accuracy was not improved by number of band but was improved by nighttime data.
The confused analysis of 7 main classes showed in Figure 4. In both cool and hot seasons, the accuracies of built up and forest were obviously increased using the combination between NDVI and LSTn. The best accuracy was obtained from paddy class. From the results, it should be explained that:
- Why accuracy of forest class was improved? Because forest has consistent temperature and homogenous vegetation cover whereas agricultural land has fluctuated temperature and heterogeneous vegetation cover depending on soil water regime, growing stage and land practices. In addition and more noted, the LST estimation is precisely in dense vegetated areas (Kerr et al., 1992). Daytime LST depends on NDVI and relative humidity while nighttime not only depends on NDVI and relative humidity but depends on latitude and elevation as well (Chada, 2000). Thus, forest in high lands where temperature in nighttime decreases can be well classified even though deciduous forest was falling in hot season.
- Why accuracy of built up class was improved? Because temperature difference between day and night times were widest compared with other land uses. Its concrete cover has highly temperature at daytime and has rapidly decreased temperature at nighttime.
- Why accuracy of paddy class was the best? Typical agricultural fields in Thailand, excepting paddy fields, are smaller than each AVHRR pixel, thus, most pixels contain a mixture of land cover classes while paddy classes are less unmixed pixels.
The new method by adding nighttime data was effective to classify land cover types by improving classification accuracy, particularly of forest, paddy and built up classes. Nighttime LST can well distinguish built up from harvested land, active paddy from active filed crop or perennial crop, and forest from active paddy and lowland tree. This indicates that nighttime data can be feasibly used to classify topographically related land cover types.
Acknowledgment
The authors wish to express appreciation to Dr. Kiyoshi HONDA, director of ACRoRS, for contributing the AVHRR images, and to Dr. Surat Lertlum, senior researcher of ACRoRS, for his helpful knowledge in NOAA-AVHRR processing. The author sincere thanks to Dr. Supan Karnchanasutham, head of Center for Agricultural Information, for his providing the updated land use map of Thailand.
References
- Chada, N., 2000. Land Cover Type Classification in Thailand Using A Combination of Vegetation Index, Day and Night Time Thermal Bands of NOAA-AVHRR. Unpublished Ph.D. Thesis, Asian Institute of Technology, Bangkok, p. 98.
- Cihlar, J., Ly, H., and Xiao, Q., 1996. Land Cover Classification with AVHRR Multichannel Composites in Northern Environments. Journal of Remote Sensing Environment, 58: 36-51.
- Deschamps, P.Y. and Phulpin, T., 1980. Atmospheric Correction of Infrared Measurements of Sea Surface Temperature Using Channels at 3.7, 11 and 12 mm. Boundary Layer Meteorology, 18:131-143.
- Kerr, Y.H., Lagouarde, J.P., and Imbernon, J., 1992. Accurate Land Surface Temperature Retrieval from AVHRR Data with Use of an Improved Split Window. Journal of Remote Sensing Environment, 41:197-209.
- Kremer R.G., and Running, S.W., 1993. Community Type Differentiation Using NOAA/AVHRR Data within a Segebrush-Steppe Ecosystem. Journal of Remote Sensing Environment, 46: 311-318.
- Lambin, E.F. and Ehrlich, D., 1997. Land Cover Changes in Sub-Saharan Africa (1982-1991): Application of a Change Index Based on Remotely Sensed Surface Temperature and Vegetation Indices at a Continental Scale. Journal of Remote Sensing Environment, 61:181-200.
- OAE (personal contact). Land Use Map of Thailand in 1995. Office of Agricultural Economics, Ministry of Agriculture and Co-Operatives, Bangkok, Thailand.
- Xue, Y. and Cracknell, A.P., 1995. Advanced Thermal Inertia Modeling. International Journal of Remote Sensing, 16: 431-446.
Night
Day and Night
Figure 1 Classified Images in Cool Season
Day
Night
Day and Night
Figure 2 Classified Images in Hot Season
Figure 3 Comparative Accuracy of Input Bands in Hot and Cool Seasons
Figure 4 Accuracy Comparisons for Each Main Land Cover Types By Using Different Input Bands