| GISdevelopment.net ---> AARS ---> ACRS 2000 ---> Landuse |
Determination of Major
Factors Affecting the Land Use/Land Cover of upper magat watershed. - a
preliminary study for the land Use/Land Cover Change Case Study of Upper
Magat Watershed Phase - Ii.
Victorino A. Bato
GIS and Remote Sensing Specialist
National Remote Sensing Center (NRSC)
Remote Sensing and Data Analysis Department (RSRDAD)
National Mapping and Resource Information Authority (NAMRIA)
Lawton Avenue, Fort Andres Bonifacio, Makati City, Philippines
Tel. No.: (632) 810-2891, (632) 810-4831 loc 640
E-MAIL : victorbato@edsamail.com.ph, nrsc@namria.gov.ph
Keywords: Land Use Change, Land Cover Change,
Magat Watershed
Abstract
This study was aimed to determine the major factors which affected the land use/land cover of Upper Magat Watershed in preparation for the land use/land cover change analysis. The study area was the Upper Magat Watershed located in the Province of Nueva Vizcaya, Philippines. Land cover classification was performed on nine Landsat TM imageries taken from different dates from 1988 to 1999. The classified imageries were compared and areas with significant changes in land cover were selected as sub-areas. Analysis of the classified and raw imageries taken from different years, field pictures and histories of sub-areas pointed to four major factors which affected the land use/land cover of the Upper Magat Watershed. They were climatic conditions, human activities through agriculture, deforestation and reforestation, natural disasters like landslides from earthquakes and soil erosion.
Introduction
It is interesting to study the dynamics of land/use land cover change of an area that is agricultural, forestry and agro-forestry based. With this knowledge we can be able to predict the availability of food and resources for the coming years. We can also recommend to policy makers remedial measures if the result of our study shows that there will be problems ahead. Land use/land cover change study is a diagnostic tool for determining sustainability. It is therefore important that this diagnostic tool be done carefully and properly.
Many factors affect land use/land cover change. Economic, drought, earthquake, cropping trends, new technologies and government policies just to name a few. Each of this factor contributes with varying degree to the change dynamics of areas. A contributory factor may be applicable in one area and not in another. It is therefore important to determine which factor contributes significantly in a specific area before a full blown land use/land cover change study can be done. In the conduct of the full blown study, only the identified significant factors will be considered and the least significant ones will be removed. This procedure will ensure that our land use/land cover change study will be relevant and in the proper direction.
Objectives
The objective of this study was to determine the major factors which affected the land use/land cover of Upper Magat Watershed in preparation for land use/land cover change analysis.
Study Background
Socio-economic and Physical Background
The study area was situated in the northern portion of the Philippine Archipelago covering majorportions of the Province of Nueva Vizcaya. Figure 1 shows the location map of the study site.
The Province of Nueva Vizcaya was composed of fifteen municipalities namely: A. Castaneda, Ambaguio, Aritao, Bagabag, Bambang, Diadi, Dupax del Norte, Dupax del Sur, Kasibu, Kayapa, Quezon, Sta. Fe, Solano, Villa Verde and Bayombong, its capitol. Its population during the 1995 survey made by the regional office of the National Statistics Office was 335,221. The economy of the study site was agricultural based. Crops like rice, corn, root crops, vegetables and fruits were the major domestic products. Farmers were also engaged in swine and cattle production.
The prevailing climate on the study site fell on two types of categories based on the Modified Coronas, type I and type II. In Type I climate, there are two pronounced seasons; dry from November to April and wet during the rest of the year. In Type II climate, seasons are not very pronounced; relatively dry from November to April and wet during the rest of the year.
The slope in the study site ranged from flat to very steep. The floodplain of the watershed was the area where most rice farming took place. The rolling and not so elevated areas were planted to upland crops, fruit trees and vegetables. Areas that were steep and/or highly elevated were mostly dipterocarp forests and some pine forests.
Concrete roads connected major municipalities of the study site. These municipalities were located on the flat lands of the watershed. Mountain trails on the other hand were the access routes to municipalities and barangays located in the highlands or areas that were separated by physical barriers like rivers and very steep mountain ridges. Mountain trails were very numerous in the watershed. Native folks and some minor ethnic groups live on very remote and steep areas accessible only through days of hike on these trails.
Historical Background on Policies
Total log ban in the Philippines was implemented around 1990 and still up to now has not been lifted. Coupled with the ban, policies like the Community Based Forest Management (CBFM), Integrated Social Forestry Program (ISFP), Community Forest Program (CFP), Forest Land Management Program (FLMP), etc began to develop to rehabilitate and improve the denuded forestlands. Sanctions like lifetime imprisonment and penalties were also imposed on violators of the law. Other than the government's Department of Environment and Natural Resources (DENR) other non-government organizations also participated in the active watch against illegal loggers.
But recently, there was a modification in the implementation of the total log ban law. This was the Sustainable Forest Management Program and one of the characteristics of this is selective logging and agro-forestry.
Historical Background on Natural D isasters
An earthquake of around intensity 7 shook the island of Luzon last 1990. This resulted to damages properties and lost lives. On the Upper Magat Watershed this resulted to the landslide of steep-unstable slopes and the siltation of Magat River and its tributaries.
The El Nino Phenomenon struck the study site and its adjoining areas from 1991 to 1995. The study site was raked among the areas in the Philippines that were severely affected by El Nino. Other than damage to crops, El Nino had also resulted to the drying of brushlands, grasslands, reduced cropping area and number per year and more occurrences of grass fires.
Methodology
Landsat TM imageries taken from different dates for ten years were used for the study. The list of imageries are presented on Table 1. The imageries were rectified using roads and river vector files as source of ground control points (GCPs). More than 50 GCPs were selected for each image and a root mean squared (RMS) error range of 1.5 to 1.9 was maintained for all imageries. All the imageries were classified and adjoining scenes were mosaicked.
Table 1. List of Landsat TM imageries
used for the study and the date they were taken.
The raw and classified imageries were examined and areas with very evident change were selected as subareas. The subareas were visited, local folks were interviewed regarding the history of the area, pictures and GPS points were taken.
Research on policies were done via interview of local government officials, library research and world wide web search.
Results and Discussion
The Macro-analysis of Land Use/Land Cover Change
The result of the land cover classification is presented on Table 2.
Table 2. Area calculation of land
cover classes from different years based on Landsat TM atellite imagery
classification.
The result of the classification of the 1999 satellite imagery was not included in the analysis because the image was 28% cloud covered. The clouds lowered the result of the area calculation of high-relief areas, which were usually dipterocarp and mossy in their land cover nature. They were not included in the final analysis because they did not reflect the true area of the dipeterocarp and mossy class. Including them would pull down the result of the trend analysis.
The distribution of land use/land cover of Upper Magat Watershed is shown below on Table 2. Majority of the land cover of the watershed were comprised of grasslands followed by dipterocarps, brushes, mossy forests, agricultural areas and barelands.
Table 2 Distribution of Land Use/Land
cover in the Study Site
Table 3. Regression Analysis for Land Use Classes
A* is the predicted area of a class in hectare
Y is the Year
The linear regression analysis (Table 3) was performed, with year as the independent variable, not as a predictive model for each class but a means of previewing the trend of land use/land cover classes with the progression of time.
Except for the built-up class, all of the classes had very low adjusted R 2 . A definite trend on land use/land cover was not established as expected. It was known for a fact that land use change would have a carry over effect for the coming years. For example grassland could not just change to forest in just a span of one year. This meant that the land use/land cover change analysis on a macro level approach was not applicable for the study site. The result of the macro-analysis approach was too general and represented the average dynamics of the watershed. It failed to pinpoint in what part of the watershed is a specific change active. For example, illegal logging can be very active in areas of the watershed that are not too accessible for environmental officers as compared to accessible areas where policies and programs are strictly implemented.
The Micro-analysis of Land Use/Land Cover Change
The raw and classified imageries of the watershed were carefully compared and areas with very evident change were separated and analyzed individually. Four sub-areas were selected and four major factors of change were identified.
Figure 3 shows imageries taken before and after the 1990 earthquake. The earthquake caused landslides on very steep, unstable or disturbed slopes. The area with the cyan color on Figure 3 #2 used to be the dwelling of a small group of settlers. This area was very steep. When the earthquake occurred, the whole side of the mountain where their houses were built slided and all the 30 people died except for one. An after effect of the earthquake was the widening of the rivers and tributaries due to siltation. Landslides were very common on the western side of the watershed, but very few on the eastern side.
Rice cropping was performed in the rice paddies three times a year and farmers do not plant at the same time. Figure 4 shows imageries of paddy fields while with rice (Figure 4 #1 and #3) and while on fallow (Figure 4 #2 and #4). This type of land use/land cover change occurred actively only on the floodplains and valleys of the watershed but very minimal on the highlands where rice croppings were done on terraces.
The climate inside the watershed was characterized in to two general categories: wet and dry. Not only did the availability of rainfall had an effect on agriculture but also on the grasslands and brushlands of the watershed. Figure 5 shows imageries of grasslands and brushlands. During the dry seasons, drying up of grasses and grass/brush fires were very common. This was further enhanced by the occurrence of the El Nino. Figure 5 #2 showed a high reflectance on the grass areas because the grass cover was thin and dry.
The log ban, together with the forestry development programs had resulted to the growth and development of forests lands. Figure 6 showed that there was an improvement in the land use/land cover from 1988 to 1998. The improvement in the land cover for this site was due to the governments promotion of agro-forestry.
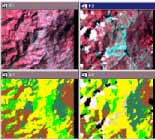
Figure 3. The effect of natural disasters on land use/land cover
(#1) raw 1988 (before the earthquake),
(#2) raw 1992 (after the earthquake),
(#3) classified 1988 (before the earthquake) and
(#4) classified 1992 (after the earthquake).
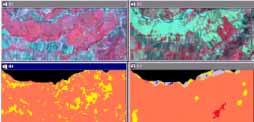
Figure 4. The effect of human intervention (agriculture) on land use/land cover
(#1) raw 1988 (planted),
(#2) raw 1996 (fallow),
(#3) classified 1988 (planted) and
(#4) classified 1996 (fallow).
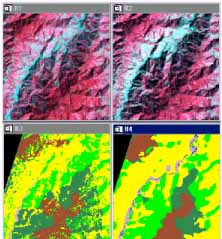
Figure 5. The effect of climate on land use/land cover
(#1) raw 1997 (wet),
(#2) raw 1998 (dry),
(#3) classified 1997 (wet) and
(#4) classified 1998 (dry)
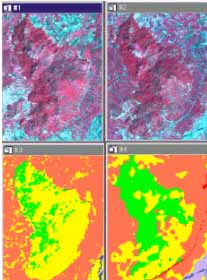
Figure 6. The effect of improvement on land use/land cover
(#1) raw (1988),
(#2) raw (1998),
(#3) classified (1988) and
(#4) classified (1998)
Conclusion
I therefore conclude that there were three major factors which affected land use/land cover of Upper Magat Watershed. They were climatic conditions, human activities through agriculture, deforestation and reforestation, natural disasters like landslides from earthquakes and soil erosion.
Further Studies
Now that the major factors which caused change in the land use/land cover of Upper Magat Watershed has been identified, they should be considered in the land use/land cover change analysis. Spatial dimension should also be established for these factors because their activities were site specific and not applicable for the whole watershed.
References
Abstract
This study was aimed to determine the major factors which affected the land use/land cover of Upper Magat Watershed in preparation for the land use/land cover change analysis. The study area was the Upper Magat Watershed located in the Province of Nueva Vizcaya, Philippines. Land cover classification was performed on nine Landsat TM imageries taken from different dates from 1988 to 1999. The classified imageries were compared and areas with significant changes in land cover were selected as sub-areas. Analysis of the classified and raw imageries taken from different years, field pictures and histories of sub-areas pointed to four major factors which affected the land use/land cover of the Upper Magat Watershed. They were climatic conditions, human activities through agriculture, deforestation and reforestation, natural disasters like landslides from earthquakes and soil erosion.
Introduction
It is interesting to study the dynamics of land/use land cover change of an area that is agricultural, forestry and agro-forestry based. With this knowledge we can be able to predict the availability of food and resources for the coming years. We can also recommend to policy makers remedial measures if the result of our study shows that there will be problems ahead. Land use/land cover change study is a diagnostic tool for determining sustainability. It is therefore important that this diagnostic tool be done carefully and properly.
Many factors affect land use/land cover change. Economic, drought, earthquake, cropping trends, new technologies and government policies just to name a few. Each of this factor contributes with varying degree to the change dynamics of areas. A contributory factor may be applicable in one area and not in another. It is therefore important to determine which factor contributes significantly in a specific area before a full blown land use/land cover change study can be done. In the conduct of the full blown study, only the identified significant factors will be considered and the least significant ones will be removed. This procedure will ensure that our land use/land cover change study will be relevant and in the proper direction.
Objectives
The objective of this study was to determine the major factors which affected the land use/land cover of Upper Magat Watershed in preparation for land use/land cover change analysis.
Study Background
Socio-economic and Physical Background
The study area was situated in the northern portion of the Philippine Archipelago covering majorportions of the Province of Nueva Vizcaya. Figure 1 shows the location map of the study site.
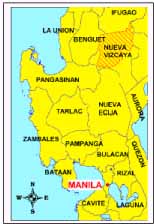
Figure 1. Location Map of the study site. |
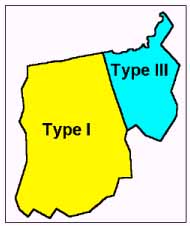
Figure 2. Climatic Map of the study site based on the Modified Coronas. |
The Province of Nueva Vizcaya was composed of fifteen municipalities namely: A. Castaneda, Ambaguio, Aritao, Bagabag, Bambang, Diadi, Dupax del Norte, Dupax del Sur, Kasibu, Kayapa, Quezon, Sta. Fe, Solano, Villa Verde and Bayombong, its capitol. Its population during the 1995 survey made by the regional office of the National Statistics Office was 335,221. The economy of the study site was agricultural based. Crops like rice, corn, root crops, vegetables and fruits were the major domestic products. Farmers were also engaged in swine and cattle production.
The prevailing climate on the study site fell on two types of categories based on the Modified Coronas, type I and type II. In Type I climate, there are two pronounced seasons; dry from November to April and wet during the rest of the year. In Type II climate, seasons are not very pronounced; relatively dry from November to April and wet during the rest of the year.
The slope in the study site ranged from flat to very steep. The floodplain of the watershed was the area where most rice farming took place. The rolling and not so elevated areas were planted to upland crops, fruit trees and vegetables. Areas that were steep and/or highly elevated were mostly dipterocarp forests and some pine forests.
Concrete roads connected major municipalities of the study site. These municipalities were located on the flat lands of the watershed. Mountain trails on the other hand were the access routes to municipalities and barangays located in the highlands or areas that were separated by physical barriers like rivers and very steep mountain ridges. Mountain trails were very numerous in the watershed. Native folks and some minor ethnic groups live on very remote and steep areas accessible only through days of hike on these trails.
Historical Background on Policies
Total log ban in the Philippines was implemented around 1990 and still up to now has not been lifted. Coupled with the ban, policies like the Community Based Forest Management (CBFM), Integrated Social Forestry Program (ISFP), Community Forest Program (CFP), Forest Land Management Program (FLMP), etc began to develop to rehabilitate and improve the denuded forestlands. Sanctions like lifetime imprisonment and penalties were also imposed on violators of the law. Other than the government's Department of Environment and Natural Resources (DENR) other non-government organizations also participated in the active watch against illegal loggers.
But recently, there was a modification in the implementation of the total log ban law. This was the Sustainable Forest Management Program and one of the characteristics of this is selective logging and agro-forestry.
Historical Background on Natural D isasters
An earthquake of around intensity 7 shook the island of Luzon last 1990. This resulted to damages properties and lost lives. On the Upper Magat Watershed this resulted to the landslide of steep-unstable slopes and the siltation of Magat River and its tributaries.
The El Nino Phenomenon struck the study site and its adjoining areas from 1991 to 1995. The study site was raked among the areas in the Philippines that were severely affected by El Nino. Other than damage to crops, El Nino had also resulted to the drying of brushlands, grasslands, reduced cropping area and number per year and more occurrences of grass fires.
Methodology
Landsat TM imageries taken from different dates for ten years were used for the study. The list of imageries are presented on Table 1. The imageries were rectified using roads and river vector files as source of ground control points (GCPs). More than 50 GCPs were selected for each image and a root mean squared (RMS) error range of 1.5 to 1.9 was maintained for all imageries. All the imageries were classified and adjoining scenes were mosaicked.
| Landsat TM Scences | Date Taken |
| 116-48 and 116-49 | January 31, 1988 |
| 116-48 and 116-49 | April 10, 1990 |
| 116-48 and 116-49 | March 30, 1992 |
| 116-49 | April 2, 1993 |
| 116-48 | May 20, 1993 |
| 116-48 and 116-49 | August 11, 1994 |
| 116-49 | March 25, 1996 |
| 116-48 | July 29, 1996 |
| 116-48 and 116-49 | October 22, 1997 |
| 116-48 and 116-49 | January 10, 1998 |
| 116-48 and 116-49 | March 18, 1999 |
The raw and classified imageries were examined and areas with very evident change were selected as subareas. The subareas were visited, local folks were interviewed regarding the history of the area, pictures and GPS points were taken.
Research on policies were done via interview of local government officials, library research and world wide web search.
Results and Discussion
The Macro-analysis of Land Use/Land Cover Change
The result of the land cover classification is presented on Table 2.
| Class | Area (ha) | |||||||
| 1988 | 1990 | 1992 | 1993 | 1996 | 1997 | 1998 | 1999 | |
| Built-up | 336.4 | 437.9 | 848.0 | 500.9 | 959.6 | 1101.3 | 841.1 | 728.4 |
| Agriculture | 23412.2 | 13756.5 | 10639.2 | 13402.0 | 27189.9 | 6751.6 | 15935.1 | 9475.7 |
| Dipterocarp | 34312.1 | 30017.0 | 16119.1 | 32257.6 | 27518.9 | 38756.0 | 37123.2 | 9927.5 |
| Brush | 36132.1 | 11065.7 | 27314.3 | 13910.1 | 45833.0 | 31713.5 | 24183.5 | 19573.5 |
| Mossy | 13729.1 | 14282.4 | 9012.2 | 14882.4 | 11897.8 | 16412.2 | 16393.1 | 5892.9 |
| Grassland | 119675.7 | 153281.2 | 126615.5 | 145973.4 | 91706.9 | 128639.6 | 127496.2 | 116642.3 |
| Bareland | 730.0 | 5218.5 | 4062.2 | v2549.0 | 5374.1 | 3762.6 | 5812.9 | 2919.3 |
| River | 798.3 | 1011.8 | 792.8 | 285.2 | 522.4 | 852.6 | 1304.8 | 527.7 |
| Cloud& Shadows | 0.0 | 55.5 | 33723.1 | 5365.7 | 18123.9 | 1137.0 | 36.5 | 63439.2 |
| Cloud Cover (%) | ||||||||
| Clouds& shadows | 0 | 0 | 15 | 2 | 8 | 0 | 0 | 28 |
The result of the classification of the 1999 satellite imagery was not included in the analysis because the image was 28% cloud covered. The clouds lowered the result of the area calculation of high-relief areas, which were usually dipterocarp and mossy in their land cover nature. They were not included in the final analysis because they did not reflect the true area of the dipeterocarp and mossy class. Including them would pull down the result of the trend analysis.
The distribution of land use/land cover of Upper Magat Watershed is shown below on Table 2. Majority of the land cover of the watershed were comprised of grasslands followed by dipterocarps, brushes, mossy forests, agricultural areas and barelands.
| 1998 Classes | Percent of total watershed area (%) |
| Built-up | 0.4 |
| Agriculture | 7.0 |
| Dipterocarp | 16.2 |
| Brush | 10.6 |
| Mossy | 7.2 |
| Grassland | 55.6 |
| Bareland | 2.5 |
| River | 0.6 |
| Cloud&Shadows | 0.0 |
Table 3. Regression Analysis for Land Use Classes
| Class | Equation* | Adjusted R Squared |
| Built-up | A=-130053 + 65.60 Y | 0.65 |
| Agriculture | A=690378.1 + -338.37 Y | 0.031 |
| Dipterocarp | A=-1227550 + 631.29 Y | -0.084 |
| Brush | A= - 1463588 + 747.83 Y | -0.137 |
| Mossy | A= -495758 + 255.62 Y | -0.042 |
| Grassland | A= - 3474645 + -1679.03 | -0.08 |
| Bareland | A= -593284 + 299.59 Y | 0.26 |
| River | A= - 30055.5 + 15.48 Y | -0.163 |
| Cloud&Shadows | A= 4390.81 + 1.99 Y | -0.2 |
Y is the Year
The linear regression analysis (Table 3) was performed, with year as the independent variable, not as a predictive model for each class but a means of previewing the trend of land use/land cover classes with the progression of time.
Except for the built-up class, all of the classes had very low adjusted R 2 . A definite trend on land use/land cover was not established as expected. It was known for a fact that land use change would have a carry over effect for the coming years. For example grassland could not just change to forest in just a span of one year. This meant that the land use/land cover change analysis on a macro level approach was not applicable for the study site. The result of the macro-analysis approach was too general and represented the average dynamics of the watershed. It failed to pinpoint in what part of the watershed is a specific change active. For example, illegal logging can be very active in areas of the watershed that are not too accessible for environmental officers as compared to accessible areas where policies and programs are strictly implemented.
The Micro-analysis of Land Use/Land Cover Change
The raw and classified imageries of the watershed were carefully compared and areas with very evident change were separated and analyzed individually. Four sub-areas were selected and four major factors of change were identified.
Figure 3 shows imageries taken before and after the 1990 earthquake. The earthquake caused landslides on very steep, unstable or disturbed slopes. The area with the cyan color on Figure 3 #2 used to be the dwelling of a small group of settlers. This area was very steep. When the earthquake occurred, the whole side of the mountain where their houses were built slided and all the 30 people died except for one. An after effect of the earthquake was the widening of the rivers and tributaries due to siltation. Landslides were very common on the western side of the watershed, but very few on the eastern side.
Rice cropping was performed in the rice paddies three times a year and farmers do not plant at the same time. Figure 4 shows imageries of paddy fields while with rice (Figure 4 #1 and #3) and while on fallow (Figure 4 #2 and #4). This type of land use/land cover change occurred actively only on the floodplains and valleys of the watershed but very minimal on the highlands where rice croppings were done on terraces.
The climate inside the watershed was characterized in to two general categories: wet and dry. Not only did the availability of rainfall had an effect on agriculture but also on the grasslands and brushlands of the watershed. Figure 5 shows imageries of grasslands and brushlands. During the dry seasons, drying up of grasses and grass/brush fires were very common. This was further enhanced by the occurrence of the El Nino. Figure 5 #2 showed a high reflectance on the grass areas because the grass cover was thin and dry.
The log ban, together with the forestry development programs had resulted to the growth and development of forests lands. Figure 6 showed that there was an improvement in the land use/land cover from 1988 to 1998. The improvement in the land cover for this site was due to the governments promotion of agro-forestry.
Figure 3. The effect of natural disasters on land use/land cover
(#1) raw 1988 (before the earthquake),
(#2) raw 1992 (after the earthquake),
(#3) classified 1988 (before the earthquake) and
(#4) classified 1992 (after the earthquake).
Figure 4. The effect of human intervention (agriculture) on land use/land cover
(#1) raw 1988 (planted),
(#2) raw 1996 (fallow),
(#3) classified 1988 (planted) and
(#4) classified 1996 (fallow).
Figure 5. The effect of climate on land use/land cover
(#1) raw 1997 (wet),
(#2) raw 1998 (dry),
(#3) classified 1997 (wet) and
(#4) classified 1998 (dry)
Figure 6. The effect of improvement on land use/land cover
(#1) raw (1988),
(#2) raw (1998),
(#3) classified (1988) and
(#4) classified (1998)
Conclusion
I therefore conclude that there were three major factors which affected land use/land cover of Upper Magat Watershed. They were climatic conditions, human activities through agriculture, deforestation and reforestation, natural disasters like landslides from earthquakes and soil erosion.
Further Studies
Now that the major factors which caused change in the land use/land cover of Upper Magat Watershed has been identified, they should be considered in the land use/land cover change analysis. Spatial dimension should also be established for these factors because their activities were site specific and not applicable for the whole watershed.
References
- Climatological and Agrometeorology Branch, Philippine Atmospheric, Geophysical and Astronomical Services Administration (PAGASA), Department of Science and Technology (DOST), August 1992. Climate of the Philippines Brochure, Quezon City, Philippines.
- Climatological and Agrometeorology Branch, Philippine Atmospheric, Geophysical andAstronomical Services Administration (PAGASA), Department of Science and Technology (DOST), 1997. Primer on El Nino/Southern Oscillation (ENSO), Quezon City, Philippines.
- Department of Environment and Natural Resources Web Site, http://www.denr.gov.ph
- Land Use Land Cover Change (LUCC) Team, Philippine Land Use and Land Cover Change Case Study, Makati City, Philippines.
- Philippine Atmospheric, Geophysical and Astronomical Services Administration (PAGASA), Rainfall and Tropical Cyclone Climatological Norms of the Philippines (1961-1990), Quezon City, Philippines.