| GISdevelopment.net ---> AARS ---> ACRS 2000 ---> Landuse |
The Study of Knowledge-Based
Database Assist for Urban Land Use Classification
Fu-jen Chien, Tien-Yin
Chou
GIS Research Center, Department of Land Management
Feng Chia University, 100 WENHWA RD., TAICHUNG, TAIWAN
TEL:(886)-4-4516669 FAX:(886)-4-4519278
E-mail: fjchien@gis.fcu.edu.tw, jimmy@gis.fcu.edu.tw
Key
WordsGIS Research Center, Department of Land Management
Feng Chia University, 100 WENHWA RD., TAICHUNG, TAIWAN
TEL:(886)-4-4516669 FAX:(886)-4-4519278
E-mail: fjchien@gis.fcu.edu.tw, jimmy@gis.fcu.edu.tw
Classification, Remote Sensing, Land use/cover, knowledge-based, GIS
Abstract
The classification of urban land use/land cover requires sophisticated skill and techniques. Traditionally, it was with non-efficiency on not only upgrading the classification accuracy by simple spectral classification technology but also increasing its categories. For this reason, this study provides an urban land use/cover classification knowledge-based system by system language model which is done through AI (Artificial Intelligence) combines with the information from RS (Remote Sensing) and GIS (Geographic Information System).
This study also trends to increase urban land use/cover categories by adding with roads, water, DTM and spectral classified knowledge. The result proves to be more effective by comparing the accuracy from the consequence of knowledge-based system and the one of traditional supervised way. It can serve as a powerful tool to apply on environmental monitoring or changing detection in the future.
Introduction
In the past, while dealing with land use classification for urban area, quite often only gray level, texture, geometric characteristics, and the knowledge from optical spectrum bands were used to classify urban land use from satellite image. The benefit from such mean is limited in the ability of land cover classification, which can't fully describe true urban land use. With the assist the knowledge-based system, it is feasible to integrate spectral information from remote sensing and established data from GIS to set as the reference material for land use classification. Through integrated database and parameters, the related uncertainty levels data can be classified. The classification procedure must relatively fit in with true land use condition, and also have a great effect on urban land use classification. Furthermore, it will avoid the inconvenience of classification procedures towards further classification. In addition to application of the knowledge-based to develop into a better condition of Urban land use classification, the focus is how to build up the knowledge-based system with spectral information in remote sensing and the indirect data in GIS, and inference from knowledge in special domain range to make classification decision. On the other hand, it is possible to hope to promote the accuracy of image classification and trace to the condition of changes after urban land exploitation.
Methodolgy
Generally, Urban land use category is complicated that needs various land use/cover classification to fit current land use/cover status. This paper applies supervised classification (maximum likelihood method) to classify conditions in land use/land cover and then join spectral characters and GIS data by knowledge-based system for increasing classification accuracy and categories. The detail steps and contents are described:
- Study Area
The district of Pe-Ten in Taichung locates at the central region of Taiwan was selected as a relevant study area. The general landscape is residential and mountainous surrounding where settlements are concentrated. The area is about 62.77km2 and population of 214,000.This region lies in a repid urbanization zone.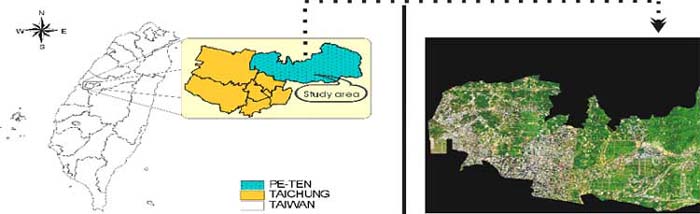
Figure1. Study Area Location
- Data Sources
The main data sources are SPOT satellite images which are the main basis of spectral knowledge, while overlay with other GIS data and DTM sources to assist for knowledge-based classification. Table 1. shows the data attribute, building time and aerial photograph is only regard as an accuracy reference
Table1. Data Sources
- Raster Images
Vector Data Data Resolution Date Data Type Date Spatial(m) Spectral(µm) Radiometric SPOT XS 12.5m 0.50-0.59
0.61-0.68
0.79-0.890-255 January 02, 1996 Major Road Line About 1997 DTM 40 m - 0-255 October 01, 1996 Rail Road Line About 1997 Aerial photograph 4m R-G-B 0-65535 November, 1998 Normal Road Line About 1997 SPOT PAN 10m 0.51-0.73 0-255 January 02, 1996 River Polygon About 1997
- Land Use Classification Hierarchies
According to the characteristic of urban land use/land cover in Taiwan, this research tends to classify land use categories including collecting regional factors and characteristic.
We classify five main categories, including:- Road: Asphalt Road, Macadam Road and etc.
- Water: River, Ocean, Stream, Ditch, Pond, Pool and etc.
- Barren Land: Sandy Beach, Salt Pan, Vacant Land and etc.
- Vegetation: Forest, Grass and etc.
- Building: Temple, Ancient Monuments, Residence and etc.
Table 2. Hierarchies and Source Rule Land use Categories Hierarchies Data Source 1 Roads Rail Road Vector Data 2 Major Road Vector Data 3 Normal Road Vector Data, SPOT XS(band1, band2, band3), Classification images, SPOT PAN 4 Water River Vector data, SPOT XS(band1, band2, band3), Classification images 5 Bare Ground Bare Ground SPOT XS(band1, band2, band3), Classification images, SPOT PAN 6 Vegetation Grass SPOT XS(band1, band2, band3), Classification images 7 Forest SPOT XS(band1, band2, band3), Classification images, DTM 8 Agriculture Area SPOT XS(band1, band2, band3), Classification images 9 Building Residential Area SPOT XS(band1, band2, band3), Classification images
- Classification Experiment and Knowledge
Representation
Knowledge-based system inference is a way to show the relationship among data with union or mixed forms from decision tree. Take forest catalog for example, there are three origin of it. They come from 1) supervised classified image 2) spectral knowledge and 3) DTM data. It has two major inference, one is "forest"?the other is "spot for forest" which comes from union results. In the rule condition, it forms from a mixed case. For instance, in the spot for forest case, it has to match all rules in spot1- spot3. It will be classified into forest catalog if it conforms to its value which is greater than 130. On the other hand, every condition must have a confidence to control its accuracy. It shows a feasible way of rules by probability forms, and it also raises a flexibility of data error tolerance.
HYPOTHESIS { ID 9; TITLE "forest"; }
SETBY 11, 12;
COLOR 0.0905205,0.589479,0.440046;
ENABLED 1;
RULE {
ID 11; }
TITLE "forest";
HYPOTHESIS 9;
ENABLED 1;
CONDITION {
VARIABLE 14 == VALUE 9 CONFIDENCE 1; }
ENABLED 1;
RULE {
ID 13;
TITLE "dtm";
HYPOTHESIS 10;
ENABLED 1;
CONDITION {
VARIABLE 16 > = VALUE 130 CONFIDENCE 1;
ENABLED 1;
}
}CONDITION { VARIABLE 7 > = VALUE 32 CONFIDENCE 1; }
ENABLED 1;
CONDITION {VARIABLE 7 < = VALUE 49 CONFIDENCE 1; }
ENABLED 1;
CONDITION {VARIABLE 8 > = VALUE 23 CONFIDENCE 1; }
ENABLED 1;
CONDITION {VARIABLE 8 < = VALUE 46 CONFIDENCE 1; }
ENABLED 1;
CONDITION {VARIABLE 9 > = VALUE 25 CONFIDENCE 1; }
ENABLED 1;
CONDITION {VARIABLE 9 < = VALUE 95 CONFIDENCE 1; }
ENABLED 1;
CONDITION {HYPOTHESIS 10 == TRUE CONFIDENCE 1; }
ENABLED 1;
Figure 2. Decision Diagram of Knowledge Representation
- Flow diagram of Knowledge-based system
Integrating data resource with the logic of knowledge-based system, this research use a complete flow framework (Figure 3.) to show the relationships from all aspects (including theme map, GIS data, spectral knowledge, model and etc) and finally the results of knowledge-based classification feed back GIS database.
Figure 3. Knowledge-Based System with Supervised Classification Flow Diagram
Result and Discussion
This study applies the above-mentioned knowledge-based system and adopts the maximum likelihood classifying themes and knowledge-based system classifying themes. Then, this study compared the accuracy from both ways. It concluded that the result of the maximum likelihood classification selected from sample area, the accuracy difference of each categories approach is about 21%, and the knowledge-based system classification can only reach 15%. It shows the knowledge-based system classification can low down the accuracy difference of each catalog. Furthermore, it concluded the accuracy of each category from the knowledge-based system classification is higher than one from the maximum likelihood classification. Especially for road catalog, its accuracy is the most obvious which approaches 26% with least bare ground only 2%. On the average, the accuracy of the knowledge-based system classification is 10% higher than the maximum likelihood classification. The outcome concluded find that it enhance a lot for classification by adding GIS data and spectral knowledge.
Figure4. Classification result with Maximum Likelihood Classification Figure5. Classification result by combining Maximum Likelihood Classification with Knowledge-Based
On the other hand, it increases the count of classifying category by GIS data. Therefore, this classification is the only effective and accurate way than traditional one. However, it still has barrier about producing null value easily by using the knowledge-based system classification. From Figure 5 it shows the null value of the knowledge-based system classification is higher than the one from maximum likelihood classification.

Figure6. The Histogram of Comparison between Maximum Likelihood and Knowledge-Based Classification Outcome
Conclusion
This research superimposes supervised classification into knowledge-based system while spectral characteristics and GIS data can increase classification accuracy and categories. But we discover additionally that easily erroneous categories would cause the appearance of null values after adding spectral characters. The result can't diagnose classification categories. Two reasons probably: 1) the conditions of spectral characteristics is better too strict to easily diagnose some classification categories. 2) the supervised classification categories don't fit in with spectral characters ,and cause indetermination. The ways of solution are adding other spectral knowledge or data, for example: Landsat TM, IKONOS or aerial photography to enlarge indetermination of pixel value. In the future, it will be noticeable for classification processing. But in the view of whole aspects of urban land use/cover, the knowledge-based system not only raises classification accuracy but also increase classification categories. It is a better way to apply on environmental monitoring of urban land exploitation or environmental changing in the future.
Refferences
- Deren LI, Kaichang DI, Deyi LI., 2000.Land Use Classification of Remote Sensing Image with GIS Data Based on Spatial Data Mining Techniques. In: International Archives of Remote Sensing. Amsterdam, Vol. XXXIII, Part B3, pp.238-245.
- A.A. ABKAR, M. A. SHARIFI., 2000.Likelihood-Based Image Segmentation and Classification: Concepts and Applications. In: International Archives of Remote Sensing. Amsterdam, Vol. XXXIII, Part B3, pp.9-16.
- ERDAS inc., 1999. ERDAS User's Guide, pp.9-24.