| GISdevelopment.net ---> AARS ---> ACRS 2000 ---> Hazard Mitigation |
Airborne Thermal IR Remote
Sensing of Lushan Geothermal Field
Chi-nan WU and Ta-Ko
CHEN
Manager, Researcher, Remote Sensing Lab
Energy & Resources Labs, ITRI
Bldg 24, 195-6 Sec4, CHUNG HSING RD.
CHUTUNG HSINCHU 310,
Tel : (886)-3-5915465 Fax : (886)-3-5820038
E-mail : 690398@itri.org.tw
TAIWAN
KeywordsManager, Researcher, Remote Sensing Lab
Energy & Resources Labs, ITRI
Bldg 24, 195-6 Sec4, CHUNG HSING RD.
CHUTUNG HSINCHU 310,
Tel : (886)-3-5915465 Fax : (886)-3-5820038
E-mail : 690398@itri.org.tw
TAIWAN
Airborne MSS, Thermal IR, Brightness Temperature
Abstract
Airborne DS-1260 MSS thermal infrared (TIR) data were used to analyze the surface temperature distribution of Lushan Geothermal Field. The main purpose is focused on detecting the geothermal outcrops for assisting the route planning of Central Cross-island Expressway, as it's deemed that a geothermal outcrop should be 500 meters away from the Expressway. TIR data were acquired in the early morning with pixel size about 9.5 meter, which were pre-processed to remove S-bend and aspect ratio effects, and GCPs were adopted to geometrically correct the image using 3'rd order polynomial equation. Vector data such as the existing roads and the planned route were also digitized to overlay with the image for the convenience of image interpretation and field check. The data quality of TIR data was evaluated by S/N and NEDT, and brightness temperature of each pixel was calibrated using plank's equation and blackbody temperatures. The resulting thermal imagery were ground-checked and interpreted, and it's found that those hot spots ( =22°C) were all irrelevant to geothermal activity, instead, they were owing to metal roofed houses, residential buildings or bare rocks located on the sunshine slope. On the other hand, the temperature of geothermal outcrops was between 19 to 21°C. It's because of the relatively coarse pixel size, small scale hot spring seepage and atmospheric absorption that the sensed geothermal temperature was lower than the actual temperature, consequently, a hot spring outcrop is not necessary appearing as higher temperature in a thermal image. Some thermal anomaly areas were located, while owing to the view angle effect or canopy shaded effect, a few small scale geothermal seepage were ignored by the TIR image, Fortunately, they are all located at a distance more than 500 meters from the planned Expressway.
1. Introduction
Airborne thermal Infrared (IR) data were adopted to analyze the surface temperature distribution of Lushan Geothermal Field from Wushe to Yunhai in central Taiwan. The main purpose is focused on detecting the hot spring activities, which will be helpful for the planning of Central Cross-island Expressway. As the hot spring areas are usually geological weak zone, the expressway should be 500 meters away from those areas. Besides, the acquired imagery could be used as ancillary data for the investigation of landslides and geology of the area. This work is a part of geological investigation during the planning stage of the Expressway, integrated by United Geotech Inc. and sponsored by National Highway Construction Bureau.
2. Data Acquisition
2.1 Scanner System
A Daedalus DS-1260 Multispectral Scanner (MSS) was used to acquire the desired remotely sensed data. DS-1260 MSS can record eleven channels of image data Simultaneously, including a thermal IR channel using a MCT or InSb detector. Thermal IR channel receives the spontaneous radiation from ground surface and it is good for temperature analysis, while the other channels receive reflected energy from the Sun, which are helpful for surface imaging. During the airborne mission, 12 channels of imagery data are recorded with a High Density Digital Tape (HDDT), the 12'nd channel also records the same thermal IR data as the 1 1'st channel but with different signal gain.
2.2 Mission Planning
(a) Target area : Lushan Area, from Yunhai to Wushe. Coordinates, TM 2 (262000, 2658000) to (275000, 2661000)
(b) Detectors : 10-channel DE 160 Spectrometer and DE 237 MCT detector. Table 1 Shows the spectral channels of the detectors.
(c) Scan line : 716 pixels, 1 byte/pixel.
(d) Field of view : 85.92°, i. e., 2.1 milli-radian/pixel.
(e) Ground resolution : within 10 meters.
(f) Flight altitude : < 5762 meter for the elevation of 1000m as at Lushan.
(g) Scanning time : predawn or early morning in order to avoid the heating effect of sunlight.
| Channel # | Wavelength ( um ) | Channel # | wavelength ( um ) |
| 1 | 0.38 - 0.42 | 6 | 0.60 - 0.65 |
| 2 | 0.42 - 0.45 | 7 | 0.65 - 0.69 |
| 3 | 0.45 - 0.50 | 8 | 0.70 - 0.75 |
| 4 | 0.50 - 0.55 | 9 | 0.80 - 0.89 |
| 5 | 0.55 - 0.60 | 10 | 0.92 - 1.10 |
| 11 | 8.0 - 14.0 |
2.3 Data Acquisition
The airborne imagery of the target area were acquired at AM 7:35 Aug. 19, 1996 with a scan rate of 25 scans/sec. During the flight, the temperature of 2 reference blackbodies was set at 10.9 and 26.4°C, respectively. The flight altitude was 18,000 ft and flight direction was 265°. As a result, 3640 scan lines were recorded, and each line contains 736 bytes of data including 20 bytes of ancillary data such as blackbody temperatures and their corresponding digital numbers (DN), gains, etc., for calibration.
3. Data Processing
3.1 Pre-processing
(a) Reformatting
The acquired imagery data in HDDT were transferred to hard disk and their data format were transformed from band interleaved (IL) to band sequential (BSQ), which are ready for the following consecutive processing.
(b) S-bend Correction
According to the imaging geometry, the panoramic effect in the image was removed. After this operation the pixel number per line is changed from 716 to 888 pixels/line.
(c) Aspect Ratio Correction
Three parameters i. e., Scan rate, ground resolution and flight speed were used to estimate the aspect ratio of the acquired imagery. For the elevation of 1000 meters as at Lushan, the computed aspect ratio is 2.77, consequently, integer 2 was adopted to minimize the aspect ratio effect. In other words, an image line is extracted from every two lines of original image.
3.2 Geometric Correction
Refer to 1:10,000 photographic base map, ground control points (GCP) were selected and their conjugate pixels were also identified in the image. A derived three order polynomial equation was then used to perform geometric correction of the acquired image, trying to fit the image as close as possible to the map.
3.3 Vector Data Digitizing
The existing roads in Lushan area and the planned route of Central Cross-island Expressway were digitized, those vector data were then overlaid on the thermal anomaly image which would be helpful for locating positions during field check and image interpretation.
4. Thermal IR Data Calibration
4.1 Data Quality Evaluation
For the acquired thermal image, the recorded blackbody temperatures and their corresponding DN were checked to evaluate data quality. It was found that the calibration parameters of channel 11 were very unstable during flight mission. Consequently, channel 12 data were selected, in lieu of channel 11, for the following processing and analysis. In channel 12, the recorded calibration parameters were relatively stable, while its gain is 0.5 instead of 1.0 in channel 11.
However, the calibration parameters of some image lines are still unstable in channel 12 data, in such case the average value of the corresponding parameters of the neighboring two lines is adopted to replace the unstable one.
4.2 Radiometric Calibration
According to blackbody temperatures and their corresponding DN, Plank's equation was used to calibrate thermal IR data. The DN value was then transformed to radiance. Signal to noise (S/N) ratio of the thermal image was also calculated and was as high as 17.36, and its noise equivalent delta T (NEDT) was 0.98 °C. These values indicate that the quality of channel 12 was acceptable.
4.3 Brightness Temperature Calculation
A radiance to temperature conversion table obtained from the above steps was adopted to calculate the brightness temperature (BT) of each pixel of the image. Table 2 lists the count of temperature distribution. The statistics are : mean BT 15.56 °C, Standard deviation 2.13°C and mode at 16°C.
| BT (°C) | # pixel | BT (°C) | # pixel | BT (°C) | # pixel |
| 4 | 94 | 14 | 284667 | 24 | 343 |
| 5 | 2390 | 15 | 244170 | 25 | 190 |
| 6 | 1501 | 16 | 341608 | 26 | 55 |
| 7 | 987 | 17 | 228066 | 27 | 34 |
| 8 | 2147 | 18 | 209711 | 28 | 13 |
| 9 | 6294 | 19 | 60446 | 29 | 5 |
| 10 | 11668 | 20 | 16234 | 30 | 2 |
| 11 | 24564 | 21 | 8987 | 31 | 1 |
| 12 | 64178 | 22 | 3088 | 32 | 0 |
| 13 | 103652 | 23 | 1056 | 33 | 1 |
By field check and comparison with base maps, it was found that those " hot spots" withBT>27°C were all located at the slope lands of Chinjin Farm and NTU Experimental Farm and they were irrelevant to geothermal activity. Instead, those thermal effects were owing to metal roofed houses or residential buildings.
5. Hardcopies Generation
5.1 False Color Composite
After contrast enhancement, images of MSS channel 4, 6, and 9, i. e. green, orange and reflected IR bands, were composite (B/G/R) for hard copy output. Such a false color composite (FCC) simulates a IR photograph for surface feature interpretation..
5.2 Pseudo-color Image of Brightness Temperature
The temperature image was transformed to a pseudo-color image in which each color represents a specific temperature range. However, owing to the atmospheric absorption effect, usually the derived BT is lower than the actual surface temperature ; also, it must be realized that the pixel temperature represents the average temperature in a area covered by that pixel. In this case the pixel coverage is about 10m×10m on the ground.
5.3 Thematic Map of Thermal Anomaly
Although the image generated in 5.2 shows the surface BT of every pixel in Lushan area, it's difficult to identity where are the pixels with higher temperature in that map. In order to distinguish "hot spots" or "hot area", the pixels with temperature greater than 19°C were extracted and overlaid on the MSS 4/6/9 FCC to generate a thermal anomaly image , in which yellow represents 20~21°C, green represents 22~23°C and red for the pixels with temperature great than 23°C (Fig.1).
6. Field Check
Field checks were carried out twice to verify the "ground truth" in Feb. and Apr. 1997. Those hot spots within 1 km along the planned route, if accessible, were checked to see if they were related to hot spring activity.
7. Results and Interpretation
In Fig. 1 the background image displayed is MSS 4/6/9 FCC, while the BT anomalies are shown in yellow, green and red colors which represent 20~21°C, 22~23°C and 24°C BT, respectively.
In MSS 4/6/9 FCC image, deep blue area is the water body of Wanda Reservoir. Light blue represents bare lands including landslides, cultivated land, road and shallow water riverbed. These surface features have similar spectral signature and consequently they appear as similar color. Pinky and reddish color indicate vegetation including forest, grass land, orchards and vegetable patches. Dark area is shadow which enhance the rugged terrain. However within some shadow area some dark greenish spots still can be seen, which were landslides or cultivated land.
Most of the high temperature anomalies were scattered on the sunshine slope, they were roadside buildings, landslides and cultivated land. The local environment is that there are many metal roofed houses in Lushan, Chinjin and Wushe, and many hotels and outdoor swimming pools locate at Lushan Spring Area. All these landuses appeared as hot spots in thermal image. It's found that all hot spots withBT>27°C were located at the dense developed area around Chinjin Farm and NTU Experimental Farm, and they were irrelevant to geothermal activity. As for bare land, the dry bare rocks had higher temperature and appeared as red, while debris had lower temperature and appeared as green or yellow color.
Lushan area is a geothermal field in the metamorphic terrain and is the typical location of Lushan Formation. Lushan is located at the middle member of Lushan Formation, the Yuanfen Member, and is sandstone-dominated. On the other hand, the Chunyang Spring Area to its west is located at the lower Chunyang Member, which is slate-dominated (Chang and Lee, 1980 ; Fan and Lee, 1994). Fractures and joints in the brittle Lushan F. are common and produce important secondary porosity for geothermal water. Geothermal water move upwards along the fractures and usually appear on the riverbed. For this reason, the detection of geothermal activities had been focused on the river valley of Talowanshi river, Mahaipushi River and a creek near Chunyang.
In Fig. 1, to the south of Muansan mountain there are many hot spots scattering and extending more than 1 km along the riverbank of Talowanshi R. This area has become a famous recreation area. However those hot spots were all buildings and outdoor swimming pools and their spring water are all from Spring Head located at 1 km upstream or from private geothermal borehole. The place 1.5 km upstream from here and on the left riverbank near PA18 borehole, there are two yellow hot spots in Fig.1 (S1). After field checks it's confirmed that they were spring outcrops. During field checks upstream along Talowanshi R. we had also found that many small spring water seepages appeared on the left riverbed, however their coverage were too small to detect in thermal image. Yellow spot N1 on the right riverbank there was also a hot spot near PA 19 borehole and below a silt arrester, during field checks we had found it was a big iron-tank. The L1 hot spot was a landslide on a steep slope where did not has any geothermal activity. Another hot area near PA20 borehole was also a landslide (L2), where Highway 14 passes by. Other hot spots such as L3 and L4 in Fig. 1 are too difficult to reach, they are also interpreted as landslide according to their spectral signature.
At 3km downstream of Talowanshi R. from Lushan it is Chungyang. The yellow spot (S2) at the intersection of Talowanshi R. and a creek had been verified as a geothermal outcrop during field check. L5 and L6 were also hot areas located at 700m and 1km upstream of that creek. On the way to check these two areas, more than ten spring seepages were found, however they could not be identified in the thermal image because of their small size. L5 was a landslide having strong geothermal activity, as we could see hot water were tapped and piped outside to hotels. Around L5 some spring seepages were also found. L6 was also a landslide, while some spring seepages appear on the other side of the creek. It is concluded that the riverbed of that creek has strong geothermal activity underlain.
In Fig. 1 there is not a hot spot at all appearing along the riverbed of Mahaipushi R. However hot water and steam seepage points were really existing at 400m upstream of the river. When we lowered the BT of color coding to 19°C and displayed the pixels having this BT as cyanine color, the hot spot S3 of this outcrop appeared. From the results it is clear that a spring outcrop is not necessarily appearing as higher temperature in a thermal image because of mixed pixel effect.
8. Summary and Conclusion
Airborne Thermal IR data were adopted to analyze the surface temperature of Lushan area during the planning phase of Central Cross-island Expressway. Results show that the sensed BT of spring outcrops was in between 19 to 21°C, and all the surface features with BT great than 21°C were bare land or buildings, the former includes landslides and cultivated patches. It's owing to the mixed pixel effect and atmospheric absorption that the sensed temperature of geothermal was lower than it's actual temperature.
The thermal anomaly areas and their surface feature near the planned route of Central Cross-island Expressway are listed as the following:
During two field checks, more than 10 geothermal spring seepages were found in both valley of Talowanshi R. and a creek near Chungyang. However, because these outcrops are small scale, seeping on the hill wall or covered by canopy, they were not sendsed by the thermal image.
| Spring outcrop : | S1 : | Near PA19 borehole, on the left riverbed of Talowanshi R. |
| S2 : | At the intersection of Talowanshi R. and a creek near Chungyang. | |
| S3 : | At 400m upstream of Mahaipushi R. | |
| Landslide : | L1 : | At 300m upstream from PA19 borehole, on the left riverbed of Talowanshi R. |
| L2 : | To the north of PA20 borehole, where Highway 14 passes by. | |
| L3 : | 800m upstream from L1, on a slope land and to the right of Talowanshi R. | |
| L4 : | On a slope land near PA21 borehole. | |
| L5 : | At 700m upstream of the creek near Chunyang, also the source of spring water piped to hotels. | |
| L6 : | At 1 km upstream of the creek near chunyang. |
One of the criteria for planning the route of the Expressway is that any thermal outcrop should not be within 500 meters from the route. Fortunately, this study shows the criterion is thoroughly fulfilled.
9. References
- Chang, P. T. and C. S. Lee, 1980. Geological Investigation of Lushan GEOTHERMAL Field, Central Taiwan. Geothermal Resources Council TRANSACTIONS Vol. 4, pp.109-112.
- Fan, C. and H. C. Lee, 1994. Report on the Re-evaluation of National Geothermal Resources in Taiwan. ERL/ITRI, Sponsored by MOEA, Taiwan.
- Wu, C., 1993. FY93 Report on The data Conversion of Airborne MSS Data. ERL/ITRI, Sponsored by COA, Taiwan.
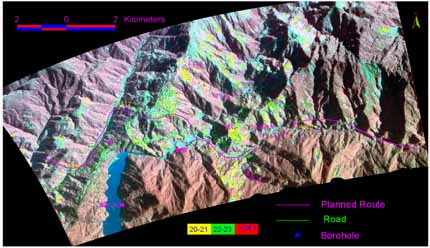
Fig 1. Thermal anomaly Image of Lushan Geothermal Field