| GISdevelopment.net ---> AARS ---> ACRS 2000 ---> Hazard Mitigation |
Development of GIS-Based
Building Damage Database for the 1995 Kobe Earthquake
Koichiro UMEMURA, Osamu
MURAO, and Fumio YAMAZAKI
Institute of Industrial Science, University of Tokyo
4-6-1 Komaba, Meguro-ku, Tokyo, 153-8505
Tel: (81)-3-5452-6388 Fax: (81)-3-5452-6389
E-mail: umemura@rattle.iis.u-tokyo.ac.jp
JAPAN
KeywordsInstitute of Industrial Science, University of Tokyo
4-6-1 Komaba, Meguro-ku, Tokyo, 153-8505
Tel: (81)-3-5452-6388 Fax: (81)-3-5452-6389
E-mail: umemura@rattle.iis.u-tokyo.ac.jp
JAPAN
the 1995 Kobe Earthquake, Building Damage Database, GIS, Digitized Data
Abstract
After the 1995 Kobe Earthquake, local governments and an organization consisted of Architectural Institute of Japan (AIJ) and City Planning Institute of Japan (CPIJ) carried out building damage surveys. Each organization made the damage database according to its own criteria. In this study, a more detailed database of damaged buildings in Nishinomiya City was developed by matching two different data sets. One of them is the building damage data surveyed by Nishinomiya City Government in Hyogo prefecture, and other one is conducted by the organization of AIJ and CPIJ and digitized by Building Research Institute (BRI). By the matching, it would be possible to utilize the detailed inventory by the former survey and the unified standard of damage assessment in the wide damaged area by the latter. This database can be used to analyze the building damage in regard to the structural type and construction period. As a result, using the damage ratio in each district and the ground motion distribution, better fragility curves can be constructed.
1. Introduction
After the 1995 Kobe Earthquake, local governments and an organization consisted of AIJ and CPIJ, carried out many building damage surveys for different purposes. They made summary reports of those surveys, and BRI and Nishinomiya City Government digitized the spatial data with the result of building damage assessment. The digitized data in the damaged area can be used effectively for the researches on urban safety planning or earthquake engineering, and the recent computer technology enables us to deal with various GIS data. The structure of the digitized GIS data is different according to the organization. Besides, each of the conducted survey has own characteristics and the databases were constructed accordingly. In this study, a more detailed database of building damage in Nishinomiya City was developed by matching two different data sets. One of them is the building damage data surveyed by Nishinomiya City Government in Hyogo prefecture. Another one is conducted by the organization of AIJ and CPIJ, and digitized by BRI. Using the results from this study, the fragility curves for buildings can be constructed more accurately comparing the two data sets.
2. Building Damage Data
The two data sets of building damage in Nishinomiya City were used in this study. One of them was the building damage data that had been investigated by Nishinomiya City Government, and another one was surveyed by the organization of AIJ and CPIJ and digitized by BRI (BRI 1996).
2.1 Building Damage Data by Nishinomiya City Government
This data set was investigated by the Nishinomiya City Government just after the Kobe Earthquake. The main purpose of the damage survey was its use for the property tax reduction. The result of the survey was also used for the distribution of the donated money from people to the victims, and for grasping the damaged area. Therefore, the standard of the damage assessment was intended for the residents. Two staff members of the local government examined and judged how much buildings were damaged by visual observation from inside and outside. This survey was carried out for two weeks after the earthquake. The classification of building damage was divided into three levels, i.e., "heavy damage", "moderate damage", and "slight damage" including "no damage". According to the damage levels, the property tax was reduced by 100%, 50%, and 10%, respectively (Murao and Yamazaki, 1999). Table 1 shows the comparison of the building data by Nishinomiya City Government and by BRI. Remarkable characteristics of the Nishinomiya data set are more detailed "structural type", including "roof type" and "construction period". These factors are very significant to construct fragility curves. The center of each building is shown as point data (Figure 1). The coordinate system is fifth of JPN.
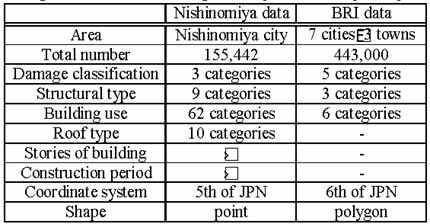
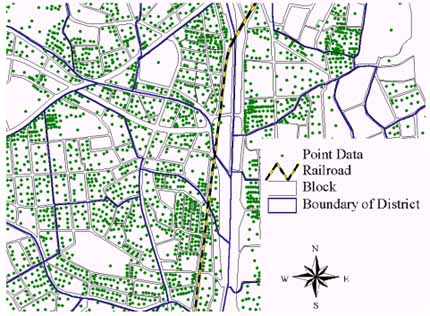
Figure 1: Point Data of Buildings by Nishinomiya City
2.2 Building Damage Data by BRI
This survey was carried out by professionals, researchers, and volunteer students who major in Architecture or City Planning. After the investigation, City Planning section of Hyogo prefecture conducted a further survey with the same method to supplement data in insufficient areas. The survey was conducted not only in Nishinomiya City but also in other cities: Kawanishi, Itami, Takarazuka, Amagasaki, Kobe and Awaji Island, to grasp the comprehensive damaged area due to the earthquake. The aim of the survey was for future academic contribution. Therefore, the assessment of the building damage was more strict and the method of the survey was more technical than that of local governments. The damage was classified into 5 categories, i.e., "collapse or heavy damage", "moderate damage", "slight damage", "no damage", and "burned". However, each building was evaluated by visual observation from outside of the building, so that the inventory does not contain "roof type" and " construction period", and the classification of "non-wooden buildings" in "structural type" is not divided. Figure 2 shows the polygon data of buildings in the BRI's GIS database. The coordinate system is sixth of JPN.
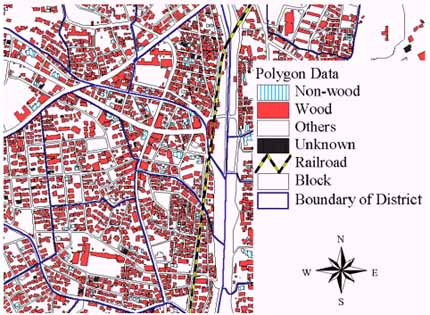
Figure 2: Polygon Data of Buildings by BRI
3. Matching the different Data Sets
3.1 Pretreatment
First, the authors had to make the Nishinomiya data (Data-1) and the BRI data (Data-2) with the same coordinate system. The coordinates of Data-1 were transformed from the fifth coordinate system of JPN to the sixth. Next, the regions of the both data sets were compared to extract the researched area for the database as shown in Figure 3. While the whole area of Nishinomiya City was made as the target of Data-1 because of the purpose for the tax reduction, the area for the Data-2 was limited. As a result, the south area of the City was extracted as the research object. One problem of the matching was that overlapped point data had existed for one building in Data-1 because the data were constructed based on the household unit. It was necessary to integrate these multiple point data into one.
3.2 Integration by the Positional Relationship
To integrate the both spatial data sets, only a spatial positional relationship was considered. Firstly, the point data of Data-1 inside the polygon data of Data-2 was extracted as shown in Figure 4. Secondly, in the other data except for the above, the distances between the points and polygons were calculated, and a point located within 3m from a polygon was matched with it as shown in Figure 5. The shortest distance is the perpendicular distance between a point and an edge of polygons or the distance between a point and a corner of polygons. Figure 6 shows the method to calculate the shortest distance. After that, these matched data were printed out on a paper, and they were compared with a detailed map.
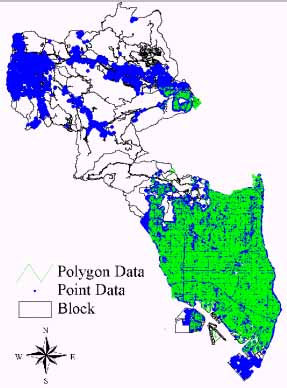
Figure 3: The Area of Nishinomiya City Covered by the Two Data Sets
3.3 Processing of Overlapped Data
In case of being more than two points inside one polygon as shown in Figure 7, these multiple overlapped data were integrated into one data set considering the building use. The reason of the overlapped points was mostly due to the difference in dealing with attachment buildings, such as garages or warehouses. The cause of it was considered and these additional data were omitted from the viewpoint of the building use. In addition, this process is carried out considering the construction period, structural type, and damage classification. Figure 8 shows the flowchart of the matching process.
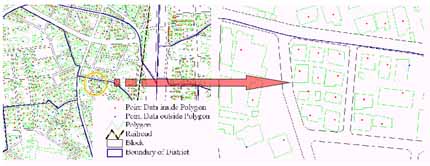
Figure 4: Matching of the Point Data inside Polygons
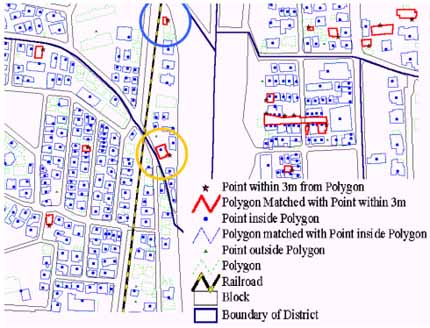
Figure 5: Matching of Point Data within 3m from Polygons of Buildings
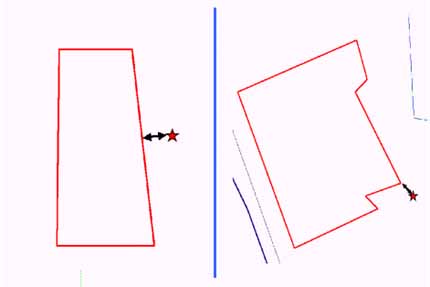
Figure 6: Method to Calculate the Shortest Distance between a Point and a Polygon
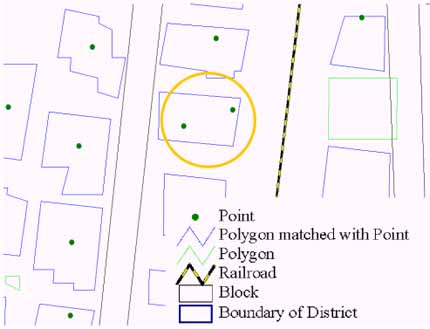
Figure 7: Integration of Overlapped Point Data Considering the Building Use
4 Conclusion
In this paper, the process to match the different building damage data sets due to the Kobe Earthquake and the importance of it were described. The authors developed this building damage database by matching Nishinomiya Government data and BRI data to supplement insufficient items. The former contains the detailed inventory, i.e., structural type (wooden, RC, steel, light-gauged steel, etc.), roof type of wooden buildings, construction period. On the other hand, the BRI data based on the survey by AIJ and CPIJ is intended for academic contribution. Fragility curves for buildings in Japan have been constructed by some researchers (e.g., Yamaguchi and Yamazaki, 2000) based on the data from the 1995 Kobe Earthquake. However, some of them are based on the tax reduction data with detailed inventory, while the others are based on the BRI data without detailed information on buildings. After the development of the GIS-based building damage database, fragility curves, which are impossible to create without matching the different data sets, can be constructed considering both the detailed building characteristics and rigorous damage classification.
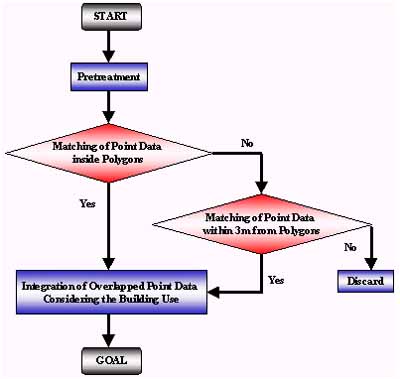
Figure 8: Flow Chart of Matching
Acknowledgements
The digitized spatial data used in this paper were provided by Building Research Institute and Nishinomiya City Government.
References
- Building Research Institute. 1996. Final Report of Damage Survey of the 1995 Hyogoken- Nanbu Earthquake (in Japanese).
- Murao, O., and F. Yamazaki. 1999. Comparison of building damage evaluation by local governments after the 1995 Hyogoken-Nanbu Earthquake. Journal of Architecture, Planning and Environmental Engineering 515, pp.187-194.
- Yamaguchi, N., and F. Yamazaki. 2000. Fragility curves for buildings in Japan based on damage surveys after the 1995 Kobe Earthquake. Proceedings of the 12th World Conference on Earthquake Engineering. Auckland, New Zealand, 8p, CD-ROM