| GISdevelopment.net ---> AARS ---> ACRS 2000 ---> Hazard Mitigation |
Landslides Triggered by the
Chi-Chi Earthquake
Hsuan-Wu Liao1,
Chyi-Tyi Lee2
1 Mr., Institute of Geophysics
2 Professor, Institute of Applied Geology
National Central University
32045 Chung-Li, Taiwan
Tel: +886-3-4253334 Fax: +886-3-4223357
E-mail: swliao@gis.geo.ncu.edu.tw , ct@gis.geo.ncu.edu.tw
TAIWAN
Keywords1 Mr., Institute of Geophysics
2 Professor, Institute of Applied Geology
National Central University
32045 Chung-Li, Taiwan
Tel: +886-3-4253334 Fax: +886-3-4223357
E-mail: swliao@gis.geo.ncu.edu.tw , ct@gis.geo.ncu.edu.tw
TAIWAN
Landslides, Earthquake, SPOT, GIS
Abstract
A large number of landslides were triggered by the Chi-Chi Earthquake (ML7.3) on September 21, 1999. These landslides have been mapped from SPOT images in this study. By using GIS (Geographic Information System) as a tool, we construct a GIS table of landslides triggered by the earthquake and analyze their characteristics, including types, distribution, areas and numbers, …etc. The distribution and areas of landslides have been compared with the distance to earthquake foci, distance to faults, distance to roads, distance to rivers, rock types, hill slopes and slope directions.
There were 9272 larger landslides (area greater than 625 square meters or 4 pixels on a SPOT image) occurred during earthquake shaking. The total area of landslides is 127.8 square kilometers. There were 8843 landslides located within the area of PGA value 250 gal and above. These landslides were distributed in an ellipse-shaped region with the major axis striking NNE, coinciding with the trend of regional faults.
Statistics shows the following results: (1) Landslides most located within the area that PGA greater than 250 gal, especially within the area that PGA greater than 300 gal. (2) A lot of landslides occurred within 20 km from the fault rupture plane. The most distant landslide locates at about 60 to 70 km away from the fault rupture plane. (3) The Toukoshan Formation, The Chinshui Shale and the Tachien Sandstone were more easily influenced by the earthquake shaking, especially at Huoyenshan Facies of the Toukoshan Formation. (4) Slopes with inclination larger than 100% involve more landslides. (5) At the hanging wall, most landslides locate at S and SE facing slopes. At the footwall, most collapsed slopes face to S, SE and SW, whereas slopes facing to other directions were not so seriously damaged. It shows that the movement of the faulting during the Chi-Chi earthquake was from SE to NW.
1. Introduction
At 1:47 a.m. local time on September 21, 1999, an ML7.3 earthquake struck the central Taiwan. The hypocenter located at a depth of 8 km beneath the Chi-Chi area. The surface rupture was along the existing Chelungpu fault. High peak ground accelerations were recorded over a broad region. The strong ground shaking induced not only considerable structural damages but also thousands of landslides.
We documented about 9000 landslides triggered by the Chi-Chi earthquake. This article provides a preliminary result, including a brief description of how we mapped the landslides, an overview of landslides distribution, and basic statistics of some factors that associated with landslides. Detailed analyses will be completed in the future study.
Method
This study utilized the use of SPOT satellite images and aerial photographs to identify the landslides. MapInfo GIS software was used to digitize the location and extent of landslides. Numbers and areas of landslides triggered by the Chi-Chi earthquake were then calculated. Spatial functions in GIS were used to analyze the relationship among the landslide distribution and factors that triggered the landslides.
Mapping the Landslides
The Chi-Chi earthquake provides a good opportunity for studying of earthquake triggered landslides. Since the influenced area was large, SPOT satellite images are used to identify the landslides. Areas that were covered by cloud were re-examined by using aerial photographs. Landslide maps before the Chi-Chi earthquake and after the earthquake were identified separately. The images used are only 6 days after the earthquake on September 26 and 27, and about 5 months before the earthquake on April 1.
We compared the location and extent of the landslides between two maps, and then separated the landslides that were really triggered by the Chi-Chi earthquake. We obeyed the following principles:
- Landslides that can be found on both maps before and after the Chi-Chi earthquake are assumed triggered by the earthquake.
- Landslides that can be found only on the map after the earthquake were assumed triggered by the earthquake.
- Landslides that can be found on the map before the earthquake but cannot be found at the map after the earthquake are assumed not triggered by Chi-Chi earthquake.
Characteristics of Landslides and Discussion
This study analyzed some relations between the landslide distribution and the factors that influence the landslide. The results are discussed as follows.
Distance to earthquake epicenter
Main shock and aftershocks locations were acquired from the Central Weather Bureau. We calculate the distance between the epicenter of main shock and the edge of a landslide. We found that most landslides occurred within 30 km from the epicenter. There are few landslides occurred over 60 km from the epicenter. The greatest distance between the landslide and the epicenter is 117 kilometers, which is smaller than the result of Keefer (1984). (Figure 2)
Distance to the fault rupture plane
We used fault rupture plane (Cheng et al., 2000) to calculate the distances between landslides and the fault plane. We found that most landslides occurred in the distance of 20 km from the fault plane. Landslides occurred in the distance large than 30 km are rare. The greatest distance between the landslide and the fault rupture plane ranged from 60 to 70 km, which is also smaller than the result of Keefer (1984). (Figure 3)
Intensity of ground shaking
We compare landslides and earthquake intensity map. We found that landslides usually occurred at the area of PGA greater than 250 gals. Areas of PGA less than 250 gals contain fewer landslides. This result is similar with some other researches.
Characteristic of the Geologic formation
Geologic conditions have great influences on landslides. This study used the 1:250000 geologic map of Taiwan from the Central Geological Survey as base map and also 1:100000 geologic maps of Maioli, Taichung and Chiai from the Chinese Petroleum Corporation for detail examinations. We found that the Toukoshan Formation, Chinsui Shale and the Tachien Sandstone were more easily influenced by the earthquake shaking, especially at Huoyenshan Facies. Because these stratums are weak, the resistances against ground shaking are relatively low.
Distance to rivers
The erosion of the rivers will make the slopes become unstable. Drainages from 1:25000 topographic maps were extracted to a GIS layer. By using buffer analysis inside the MapInfo GIS, we found that a large number of landslides happened in the distance of 300 meters from the drainage channels.
Distance to Roads
The appearances of road represent human activities that accelerate the erosion rate. This study also extracted roadways from 1:25000 topographic maps into GIS. By applying the same process we found landslides at the distance less than 80 meters from the road are more than the landslides at the distance between 80 meters and 200 meters. But much more landslides were located outside the vicinities of roadways.
Slope Angle
Slope angle is the most important factor controls the landslide occurrence. Slope angle map was calculated from the 40 meters resolution digital terrain model (DTM). We found that the slopes inclination larger than 100% involve much more landslides.
Slope Orientation.
Earthquake shaking may have preferred orientation. Therefore, landslides may occur more frequently at slopes facing to certain direction. This study extracted slope direction from DTM. We found that at the hangingwall, most S and SE facing slopes collapsed. Meanwhile, slopes at the footwall collapsed mostly at S, SE and SW direction. Slopes facing to other directions were not so seriously damaged. It shows that the movement direction of the Chelungpu fault was from SE to NW.
Conclusion
There were 9272 larger landslides (area greater than 625 square meters or 4 pixels on a SPOT image) occurred during earthquake shaking. The total area of landslides is 127.8 square kilometers. There were 8843 landslides located within the area of PGA value 250 gal and above. These landslides were distributed in an ellipse-shaped region with the major axis striking NNE, coinciding with the trend of regional faults.
Statistics shows the following results: (1) most landslides locate within the area of PGA greater than 250 gal, especially within the area of PGA greater than 300 gal. (2) The majority of the landslides occurred within a distance of 20 kilometers from the fault rupture plane. The greatest distance from the fault rupture plane is about 60 to 70 km. (3) The Toukoshan Formation, the Chinsui Shale and the Tachien Sandstone were more easily influenced by the ground shaking, especially at Huoyenshan Facies of the Toukoshan Formation. (4) Slopes with gradient larger than 100% involved with more landslides. (5) At the hangingwall, most landslides occurred at S and SE facing slopes. At the footwall, most landslides concentrated at S, SE and SW facing slopes, whereas slopes facing to other directions were not so seriously damaged. It shows that the movement of the faulting during the Chi-Chi earthquake was from SE to NW.
Reference
- Keefer, D. K. (1984) Landslides caused by earthquakes: Geol. Soc. Amer. Bull., 95, 406-421.
- Cheng, C.T., Lee, C.T., and Tsai, Y.B. (2000) Fault rupture plane and attenuation model associated with the 1999 Chi-Chi earthquake. Proceedings of the 2000 Annual Meeting of the Geological Society of China, 21-23. (in Chinese)
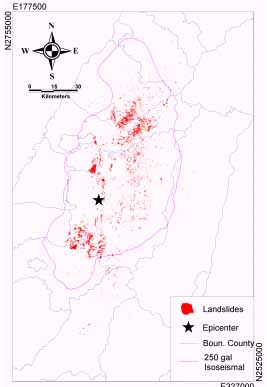
Figure 1 Landslides triggered by the Chi-Chi Earthquake
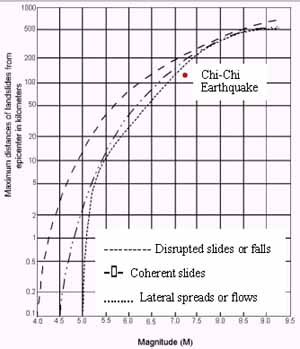
Figure 2 Maximum distances of landslides from epicenter and magnitude relation
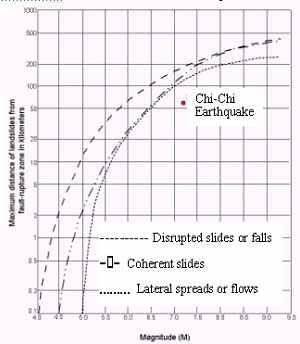
Figure 3 Maximum distances of landslides from fault rupture zone