| GISdevelopment.net ---> AARS ---> ACRS 2000 ---> Hazard Mitigation |
Integrating Remote Sensing
and GIS for Fire Hazard Categorization & Resource Allocation. A case
study of Bathurst, New South Wales, Australia.
Sunil Bhaskar
School of Geography, Faculty of Science and Technology
University of New South Wales, 2052, Kensington
Australia
Tel: +61-02-9385 5537
Fax: +61-02-9313 7878
Email: z2240167@student.unsw.edu.au
KeywordsSchool of Geography, Faculty of Science and Technology
University of New South Wales, 2052, Kensington
Australia
Tel: +61-02-9385 5537
Fax: +61-02-9313 7878
Email: z2240167@student.unsw.edu.au
Fire hazard categorization, dynamic resources, spatial unit, spatial analysis
Abstract
'Fire hazard categorization' is vital for emergency planning in order to minimize loss of lives and property. Recording hazard levels help in understanding the spatial distribution of fire susceptibility and vulnerable areas and assist in the 'Allocation' and 'Mobilization' of dynamic resources. Insitu field surveys are carried out to determine fire hazard categories in New South Wales. Although reasonably accurate, this method of classifying hazards is time consuming, not very accurate and most importantly does not permit spatial analysis. It also leaves out important important variables that need to be considered for a comprehensive hazard categorization. This paper examines the integration of high-resolution orthorectified aerial photoimages with GIS in order to develop a methodology to generate fire hazard categories. It also examines the choice of an appropriate 'spatial unit' to record and compare hazard categories in a given region for the effective management of dynamic resources.
1. Introduction
Fire hazards cause widescale destruction within no time and are the scourge of modern civilization. Although fire hazards cannot be avoided totally, they can be studied within the spatial context for better preparedness and mitigation. It is vital that hazard levels be generated in order to understand the spatiality of fire hazards and enable distribution of the minimal dynamic resources in a balanced manner.
The present method of generating fire hazard categories is by an insitu field survey method where a physical assessment of structures is carried out and recorded on every Unit Survey Squares (USS) derived from the 1 km square Australian mapping grid (Corporate Strategy Group, 1996). This structure is then related to a detailed descriptive table (Table 1) that scales the hazard from low to very high or special hazard. This method of classifying hazards is beset with a few issues that need to be addressed. Emergency services need current information to make on the spot decisions. Data acquisition by insitu field survey does not capture the current spatial details on landuse or usefunctions of structures and involves too many man-hours and finance.
The current approach is focussed on the identification of hazards based on inventory, alone which has a legislative attraction. The neglect of spatial context and potential population exposure can also pinpoint to the technical and engineering focus of many working in this area, operating within a traditional 'hazard perspective' concentrating on ensuring the integrity of on-site safety systems and finding engineering solutions to accident prevention (Rayner S, 1992). Spatial context can be an important factor in determining the scale of potential harm but has often been neglected in setting of criteria or thresholds which determine levels of risk management attention (Gordon et al , 2000). Recent perspective on natural hazards also emphasize the wider spatial and social context within which disasters are experienced. The concept of vulnerability has been particularly important, encompassing the physical relationship between hazards and communities at risk, accident preparedness and mitigation and the social geography of potentially affected populations (Blakie et al, 1994).
Other factors, such as preparedness of communities in different locations and the social characteristics of different groups within communities at risk, are also important and need to be incorporated into a more complete analysis of 'human ecology of endangerment' (Hewitt K, 1997).
Study Area and Data Collection
The city of Bathurst is chosen for the study since it has a mixed type of landuse and is representative of a considerable part of the New South Wales province. Bathurst is located approximately 210 kms to the west of Sydney and is a growing industrial city. The other study area of Hornsby has a residential-bushland interface. It is believed that the benefits of the study in these two sites will be extrapolated to most of New South Wales.
High-resolution orthorectified color aerial photo images exposed in 1998, september are used mainly for visualization and synoptic capture of data. All the other vector layers were a mix of point, line and polygon features and carried information about the land parcels, important location and demographic features. The datasets were matched to a single coordinate system and spheroid so that they could be overlaid and analyzed. An attempt is also made here to address the issue of GIS data redundancy and data sharing within alike government and non-governmental agencies. Demographic variables like age of people and number of dwelling were extracted from the 1996 census data.
Methodology and Analysis
Most of the modeling tasks were performed on multiple GIS packages including ArcInfo version 8.0.2, MapInfo and ArcView and the supervised classification was carried out with an Image Analysis software ENVI. The major task apart from mapping the fire hazards in the city of Bathurst was to develop a methodology that could be replicated easily over the entire state. The local environment plan (LEPs) was overlaid on the image for arriving at the broad land-use classes. Variables of demographic data like age, number and type of dwellings gave a description of the proximity of people and structures to the fire hazards. The location of 'Special Hazards' was one of the main nonstructural hazard criteria in identifying the location of 'Special Hazards' for each spatial unit. The density, size of the roof area, proximity of use functions of structures, measure of compactness was calculated separately for each spatial unit before arriving at the different scales of fire hazards. The roof area was calculated by training sites on the raster image and performing a supervised classification using the maximum likelihood method. Several classes of concrete, bitumen, terracotta roof were identified on the RGB colour composite image. A raster to vector conversion created polygons for all the different features. These were transferred to a GIS platform for further analysis. Several spatial units were considered for the choice of the most appropriate spatial unit like the census collectors unit, the 250 by 250 and 500 by 500 metre grid, and land parcels. Emphasis was not restricted to the geometric aspects of the spatial unit for GIS analysis but also on the conceptual aspects of spatial unit for hazard categorization. The total built up area for the basic spatial unit (BSU) was calculated to arrive at a measure of the congestion, which gives a measure of the difficulty of 'Fire containment'. The study selected data sets that were already available within the state of New South Wales, so that the methodology could be replicated easily.
Scope and Discussions
Fire hazards levels should incorporate other variables also since the true definition of hazard will necessarily incorporate location of dangerous sites as well as the community who may be affected by the hazard. Location is an important variable for understanding the spatial distribution of fire hazards but a wider perspective needs to taken to classify and categorize hazards. An understanding of fire hazard must encompass the threat posed by the physical structure, the geographical setting of the region, the community in the vicinity at risk. In the true sense the magnitude of a hazard that classifies it into a major or minor one will be determined by numerous factors but chiefly by the type of structure Chemical Plant, Nuclear reactor, Industries etc and the number of people living in the proximity of that area. The 250 by 250 m good areal unit provides a good basis for comparing the hazard level in one region to that of another. Spatial distribution of fire hazards can be synoptically captured by current remotely sensed data in a short period of time.
Results
A methodology to categorize fire hazards was developed integrating remotely sensed raster data with cartographic vector data GIS and a spatial database to store and analyze fire hazards in the city of Bathurst, NSW, Australia was developed on a consistent and continuous coordinate system. Datasets that are available with all the councils within New South Wales were used selectively to devise the methodology so that it could be applied to other parts of the New South Wales State. The 250 x 250 metre grid was found to be the most appropriate 'areal unit' for the purpose of 'Hazard Categorization' and allocation of dynamic resources.
Acknowledgments
The study is a part of an ongoing joint project between the New South Wales Fire Brigades and the University of New South Wales supported by a scholarship from the New South Wales Fire Brigades and the author is particularly grateful to Trevor Neal, Dr Bruno Parolin and Professor Barry Garner for their advise.
References
- Corporate Strategy Group, "Hazard Categorization Project", The New South Wales Fire Brigades.1996.
- K.Hewitt, "Regions of risk: a geographical introduction to disasters Longman, Harlow, U.K. 1997.
- P.T. Blakie,T.Cannon, I.Davis, B.Wisner "At risk:natural hazards,people`s vulnerability and disasters. London:Routledge 1994.
- S.Rayner, "Cultural theory and risk analysis". In: S.Krimsky, and D.Golding, Editors, "Social Theories of risk" Praeger, Westport,CT. 1992.
- W.Gordon,J.Mooney,D Pratts "The People and the Hazard: the spatial context of major accident hazard management in Britain", Vol 20 pp119-235, 2000
| General Hazard Type | Specific Hazard Category | Map Colour Code | Brief description of hazard |
| Special Hazard | Category 1 | Red | A site that poses extreme hazards for people, property or environment, eg some hospitals and aged hostels, major lpg depots, chemical plants, oil refinery, etc. |
| Intermediate | Category 2Category 3 | OrangeYellow | May include some high hazard residential-but basically high hazard industrial/commercial occupancies with a high level of structural density within the Unit Survey Square.May include some high hazard residential-but basically high hazard industrial/commercial occupanc`s with low to moderate level of structural activity. |
| Low or base level hazard | Category 4Category 5 | Dark greenLight green | A fully developed area of residential and low hazard industrial/commercial occupancies.A partially developed area of residential and low hazard industrial/commercial occupancies |
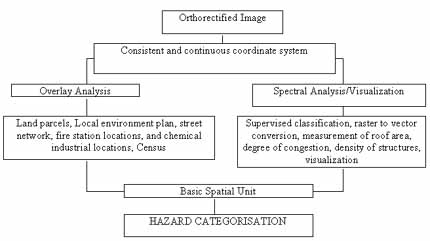
Fig. 2 Work Process