| GISdevelopment.net ---> AARS ---> ACRS 2000 ---> Hazard Mitigation |
Drought and Vegetataion
Monitoring in the Arid and Semi-Arid Regions of the Mongolia using Remote
Sensing and Ground Data
Yu.
Bayarjargal1, Ts. Adyasuren2 and Sh.
Munkhtuya3
1Remote Sensing Lab., J.Blaustein Institute for Desert Research,
Ben Gurion University, Sede Boqer-84990, ISRAEL
Tel: +972-7-6596856, Fax: +972-7-6596805;
E-mail: yub@bgumail.bgu.ac.il
2National Committee of the Combat Desertification,
Ministry for Nature and the Environment,
3National Remote Sensing Center,
Ministry for Nature and the Environment, MONGOLIA
Keywords1Remote Sensing Lab., J.Blaustein Institute for Desert Research,
Ben Gurion University, Sede Boqer-84990, ISRAEL
Tel: +972-7-6596856, Fax: +972-7-6596805;
E-mail: yub@bgumail.bgu.ac.il
2National Committee of the Combat Desertification,
Ministry for Nature and the Environment,
3National Remote Sensing Center,
Ministry for Nature and the Environment, MONGOLIA
Drought, land surface temperature, vegetation index
Abstract
The Gobi Desert and the Desert Steppe regions of the Central Asia within an area of approximately 60% of the country's territory of Mongolia are naturally the main part of the grazing livestock husbandry. The natural disasters such as drought and heavy snowfall states are often observed there. Over this regions drought occurs on an average of once every two or three years. Short-term operational detecting and monitoring of the natural hazards as well as droughts over large territory will contribute to meeting requirements of the economical development of the country. Coarse spatial resolution, high temporal frequency satellite data from the NOAA/AVHRR based technology and methods are widely used to monitor vegetation cover and drought episode throughout the world. This paper presents some results of detection of drought-affected regions by calculating the Normalized Difference Vegetation Index (NDVI) and the Land Surface Temperature (LST) values of the drought and wet years. The NDVI-LST space based drought indicator was tested and by use of this indicator can be detect and operationally monitor of drought distribution over the territory of the country.
1.Introduction
Mongolia has expansive areas (almost 90%) of natural grasslands and current dominant industry in the agricultural sector of the country is the nomadic livestock husbandry which is highly dependent upon the conditions and changes in nature and the environment during the four seasons of a year. Almost 99% of the Gobi Desert and Desert Steppe - arid and semi-arid zone are used as natural pasture. In the above-mentioned vast Gobi Desert and Desert Steppe area are often occur the natural disasters such as drought and heavy snowfall states. Over this regions drought occurs on an average of once every two or three years and the heavy snowfalls occurs every 5 to 6 years and once every 2 to 3 years covering half and quarter of country's territory, respectively (Shiirevdamba, 1998). The summer frequent droughts and severe winter's forces are intensifying desertification in arid, semi-arid and sub-humid areas of Mongolia. Coarse spatial resolution, high temporal frequency satellite data from the Advanced Very High Resolution Radiometer (AVHRR) operated by the National Oceanic Atmospheric Administration (NOAA) based technology and methods are widely used to monitor vegetation cover and drought events throughout the world (Goward et al., 1985; Walsh, 1987; Reed, 1993; Kogan, 1997; Karnieli 1999). In Mongolia, several studies involving the use of the NOAA/AVHRR data have been published. Most of them had concerned with determining vegetation cover study (Oyun et al., 1994; Adyasuren and Bayarjargal, 1995; Bayarjargal, 1995). Recently, Adyasuren and Bayarjargal (1995) mapped drought conditions of the Central Asian zone based on the multi-temporal Global Vegetation Index data from 1982-1987 and noticed that when a drought events occur in the Mongolian Gobi Desert zone, the Normalized Difference Vegetation Index (NDVI) values became to a low values, 0.0-0.05 units, same as value of the extra-arid land - Taklimakan Desert. As mentioned, previous works have introduced that the AVHRR derived NDVI images are useful for analysing spatial vegetation pattern and for assessing vegetation dynamics. However, from a synoptic point of view is required to improve the vegetation cover and dynamic estimation technology as well as to assess the impact of natural drought and its overall extent in space and time, especially in the Gobi Desert and the Steppe area of the Mongolia.
2. Climate Description of Study Area
Mongolia is a land-locked country which covers an area of 1.5 million square kilometers on the southernmost fringe of the Great Siberian boreal forest and the northernmost Central Asian deserts and vast steppes. The main characteristics of the climate of Mongolia are sunny days, long and cold winters. The average mean air temperature in the warmest month is 15-20oC in the north, and 20-25oC in the south of Mongolia. In the Gobi Desert and Steppe zones, the summer continues over 3 months. The maximum summer air temperature can reach anywhere 35-39oC in the north and 38-41oC in the south. The total annual precipitation in mountainous regions averages to about 400 mm, in the steppe 150-250 mm and in the desert-steppe less than 100 mm. About 85 to 90 per cent of the precipitation falls during the three summer months (Shiirevdamba, 1998). The number of rainy days decreases from north to south. The temporal and spatial distribution of precipitation in Mongolia is variable. There is very little precipitation at the beginning of the growing season but much more in the second half of the season when cool air starts to spread around the country. This variation has considerable effects on the growth of several spring plants. Summer, autumn and winter precipitation is a source of soil moisture but it is insufficient for vegetation to thrive in this country.
3. Methodology
In order to carry out the study, we classified the territory of Mongolia into four dryness zones such as the humid, the sub-humid, the semi-arid and the arid zone, by NDVI data, vegetation types and as well as according with desertification and geobotanic maps (Kharin et. al., 2000; Shiirevdanba, 1998). The fourteen plots shown in figure 1 have been chosen which are corresponds to the arid and semi-arid zones. Monthly total rainfall data and monthly composite of the NDVI and LST data for the period April to September of 1992-1995 were used. Prolonged drought, which has been affecting arid and the semi-arid areas, as well as high land surface temperatures which are reached in summer with June and July. The original images from the NOAA/NASA Pathfinder AVHRR Land Data Set, which have been monthly composite and 8 km spatial data, were derived. Prior to analysis, the images were geometrically corrected to a master image using a ground control points and applying a first order transformation into Geographic Projection. The NDVI data calculated from AVHRR channel-1 and channel-2 reflectances and the NDVI is has been shown to be highly correlated with vegetation parameters such as green-leaf biomass and green-leaf area and, hence, is of considerable value for vegetation discrimination (Justice et al. 1985). The NDVI defined mathematically as NDVI=[NIR-R]/[NIR+R], where R and NIR are the radiance or reflectances in the red and the near-infrared spectral channels, respectively (Rouse et al. 1974). The LST computed from AVHRR channel-4 and channel-5 brightness temperatures through the split window methods for land surfaces (Price, 1984; Kerr et al., 1992; Qin and Karnieli, 1999). The LST is correlative to evapotranspiration since it is highly controlled by the radiation received at the surface and the latent heat flux from the surface to atmosphere. This heat loss is responsible to the LST. The NDVI and the LST maximum value composites (MVC; Holben, 1986) were produced from all the images available within the monthly periods for the four study years. The MVC minimizes the effects of atmosphere, scan angle, and cloud contamination (Lambin and Ehrlich, 1996).
In this study we were tested NDVI-LST space based drought indicators which are developed by Karnieli (1999). Also we were developed drought monitoring indicators based on normalization method in the NDVI-LST space of a local area.
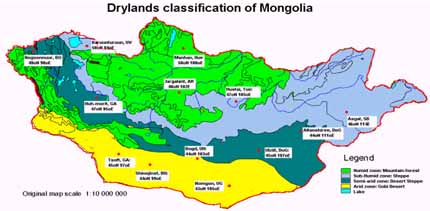
Figure 1. Dryness zone classification of the Mongolia (based Kharin et. al.,2000 and Shiirevdanba, 1998). Thirteen plots position are used for drought estimation.
4. Analysis and Results
The warm seasonally (from April to September) temporal analysis of the arid and the semi-arid areas in the NDVI-LST space were performed on the NDVI and LST data sets for the selected four years. In the summer of 1992 and in the summer and fall of 1995 were severe droughts within the whole territory of the Mongolia. The average summer air temperatures were 19oC and 18oC in the 1992 and 1995, respectively. The average total rainfalls were 52 and 76 mm in the arid area and 100 and 114 mm in the semi-arid area in the summer of 1992 and 1995, respectively. In 1996, the worst year in Mongolian history, altogether 417 forests and steppe fires (over 10.5 million hectare) occurred due to dryness - as effects of sever drought which occurred in the fall of 1995. The other two years were relatively wet years-1993 and 1994 with rainfalls 100 and 75 mm in the arid and 155 and 142 mm in the semi-arid zone, respectively. From the warm months temporal variations of the NDVI and LST on the some plots of the arid and semi-arid zones presented in figure 2 and it might be noticed that the a lower NDVI and a higher LST values occurs on the dry years and a higher NDVI and a lower LST values occur on the wet years, respectively, on the both arid and semi-arid areas.
In order to discover any relations in the warm seasonal NDVI, LST and total rainfall the correlation coefficients were performed in the different dryness zones (Table 1). As can be seen from table 1, the correlations between of those parameters vary in throughout the dryness zones. On this table, two directions of warm seasonal variations of the NDVI, LST and total rainfall values: (i) for arid zone, characterized by a both negative relations of the NDVI with LST and rainfall, respectively and (ii) for other dryness zones, a relations of NDVI-LST and NDVI-rainfall are positive and increases from semi-arid zone (low latitude) to humid zone (high latitude). But only the correlation of LST and Rainfall were almost equal and positive in whole territory, during the vegetation growing period. An interesting conclusion from table 1 and figure 2 is that, in the whole territory, most of the temporal variability during the warm period in ecological characteristics depends a local condition (i.e., land cover type, landform, local climate, latitude).
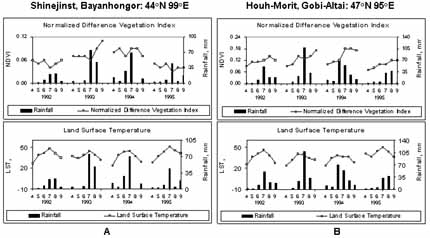
Figure 2. Warm months temporal variations of the NDVI and LST on the sample plots correspond to arid (A) and the semi-arid (B) zones.
| Conditions | Dryness zone | ||||
| Arid | Semi-Arid | Sub-Humid | Humid | ||
| Wet years (1993, 1994) | NDVI and LST | -0.10 | 0.35 | 0.36 | 0.50 |
| NDVI and Rainfall | -0.20 | 0.36 | 0.54 | 0.76 | |
| LST and Rainfall | 0.75 | 0.61 | 0.51 | 0.59 | |
| Drought years (1992, 1995) | NDVI and LST | -0.35 | 0.14 | 0.44 | 0.56 |
| NDVI and Rainfall | -0.27 | 0.17 | 0.57 | 0.73 | |
| LST and Rainfall | 0.69 | 0.69 | 0.66 | 0.74 | |
Most suitable method for estimate local a condition in any case is establishing a "normal" value. We may considered that the NDVI and LST of 1993 are used as a "normal" years and calculated as:
LSTdifferenced =[LST1993 - LSTi]/LST1993
where NDVIdifferenced and LSTdifferenced are subtracted values from a year of normal precipitation -1993. NDVIi and LSTi are values of any particular year. In order to characterize the drought years, warm seasonal time trajectories of the "differenced" two products were applied for other drought occurred and wet years and some selected points from arid and semi-arid area illustrated in the Figure 3. Due to moisture stress on the vegetation, NDVI/LST values recorded in the dry years should be lower/higher than those values recorded in a "normal" year; therefore drought occurred areas will have high/low NDVIdifferenced / LSTdifferenced values. Bottom part of Figure 3 shows that the mean values and the line connected between the maximum LSTdifferenced with minimum NDVIdifferenced and minimum LSTdifferenced with maximum NDVIdifferenced values. It might be seen that the drought occurred years, 1992 and 1995; lines and mean values are very similar terms of position and angle in the both arid and semi-arid zones. The mean value and the line - connected maximum and minimum values of the calculated NDVIdifferenced and LSTdifferenced were used as indicators for detecting and monitor drought events. The lines of the drought years' are steeper and shorter, whereas the wet (1994) years lines are gentler and longer. The mean values of the NDVIdifferenced and LSTdifferenced of drought years' are always located in the lower-right part of the NDVI-LST space-system, i.e., they have a positive NDVIdifferenced and the negative LSTdifferenced value in the drought year. In the opposite, wet year's mean values are positioned in the upper-left part in throughout the arid and the semi-arid zones.
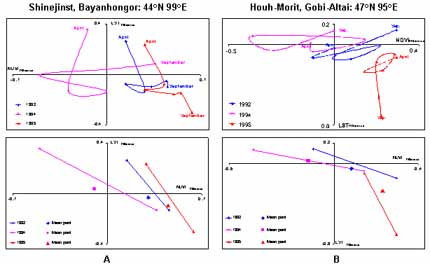
Figure 3. Warm seasonal time trajectories (upper part) of the NDVIdirrerenced vs. LSTdirrerenced (subtracted from1993) for drought years (1992 and 1995) and the wet year (1994) on the sample plots correspond to arid area (A) and semi-arid (B) zones. The lines (bottom part) connected between the maximum LSTdifferenced with minimum NDVIdifferenced and minimum LSTdifferenced with maximum NDVIdifferenced values correspond to upper parts.
5. Summary and Conclusions
Several previous investigations have shown that the multi-temporal NOAA-AVHRR based NDVI and LST are suitable study for land cover classification in Africa, climate variability in southern Sahel, deforestation of Central African evergreen forest, and for quantify droughts in sparse vegetated area of the Negev Desert. All of those area located in relatively low latitude when there were drastic negative relations between those two parameters. We get such kind of relations in the middle latitude area, such as in the Gobi Desert arid area. But in the semi-arid area in the middle latitude we could discover positive relations between those two parameters. Based on differenced method we found a drought indicator - well suitable in the arid and semi-arid area of Mongolia. Due to moisture stress on the vegetation, NDVI (LST) value recorded in the dry years should be lower (higher) than those values recorded in a "normal" year; therefore in drought occurred areas, drought indicator - NDVIdifferenced (LSTdifferenced) values will be high (low) than normal and wet years. It is concluded that the AVHRR based NDVI and LST can provide valuable information for drought detecting and monitoring by operationally.
Acknowledgements
The authors would like to thank to Dr. Arnon Karnieli of the Remote Sensing Laboratory of the J. Blaustein Institute for Desert Research (BIDR) for his discussions, comments and assistance for able to present this paper on the ACRS-2000. We would also like to thank Ph.D. Q. Zhihao, Spatial Modelling Center of the Sweden for his suggestion and assistance for calculating the LST on study area.
References
- Adyasuren, Ts., and Yu. Bayarjargal, 1992. Studies of Vegetation Change on the Territory of Mongolia using AVHRR and Meteorological Ground Data. Proceedings of the 13th Asian Conference on Remote Sensing, Ulaanbaatar, Mongolia, D-9.
- Adyasuren, Ts., and Yu. Bayarjargal, 1995. Vegetation & Drought Monitoring Using Sattelite & Ground Data. International Seminar on Space Informatics for Sus. Devel.: Grassland Monitoring & Management. Ulaanbaatar, 20 June, Mongolia.
- Bayarjargal, Yu., 1995. Estimation of grassland primary production and carrying capacity at the Hustain-Nuruu Nature Reserve. Project Final Report, Ulaanbaatar, pp.15.
- Goward, S. N., C. J. Tucker, and D. G. Dye, 1985. North American vegetation patterns observed with the NOAA-7 Advanced Very High Resolution Radiometer. Vegetation, 64:3-14.
- Holben, B.N., 1986. Characteristics of maximum-value composite images from temporal AVHRR data, Int. J. Remote Sensing, 7:1417-1434.
- Justice, C.O., J.R.G. Townshend, B.N. Holben, and C.J. Tucker, 1985. Analysis of the phenology of global vegetation using meteorological satellite data, Int. J. Remote Sensing, 6:1271-1318.
- Karnieli, A., 1999. Space monitoring of Soil and Vegetation Dynamics in the Negev Desert (Israel), (in press International Journal of Remote Sensing)
- Kerr, Y.H., Lagourde, J.P., and J. Imbernon, 1992. Accurate land surface temperature retrieval from AVHRR data with use of an improved split window algorithm Remote Sens. Environ. 41, pp. 197-209.
- Kharin, N., R. Tateishi and H. Harahsheh, 2000. A New Desertification Map of Asia. Desertification Control Bulletin, 36, pp. 5-17.
- Kogan, F. N., 1997. Global Drought Watch from Space. Bulletin of the American Meteorology Society, 78, 621-636.
- Lambin, E. F., and D. Ehrlich, 1996. The surface temperature-vegetation index space for land cover and land-cover change analysis. International Journal of Remote Sensing, 17:463-487.
- Oyun, R., Bayarjargal, Yu., and M. Enkhbayar, 1994. Development of methodology for estimation of grassland primary production at the Hustain NN.R.. Fin.report, Ulanbaatar, pp. 80.
- Price, J. C., 1984. Land surface temperature measurements from the split windows channels of the NOAA-7 AHVRR. Journal of Geophysical Research, 89:7231-7237.
- Qin, Zh., and A. Karnieli, 1999. Progress in the remote sensing of land surface temperature and ground emissivity using NOAA-AVHRR data. Int. J. Remote Sensing, 20 (12): 2367-2393.
- Reed, B.C., 1993. Using remote sensing and GIS for analyzing landscape/drought interaction. Int. J. Remote Sensing, 14(18): 3489-3503.
- Rouse, J. W., Haas, R. H., Schell, J. A., Deering, D. W., and J. C. Harlan, 1974. Monitoring the Vernal Advancements and Retroradation (Greenwave Effect) of Nature Vegetation. NASA/GSFC Final Report, NASA, Greenbelt, MD, 371 pp.
- Shiirevdamba, Ts., 1998. Biological Diversity in Mongolia, First National Report, Ministry for Nature and the Environment, 'Admon' printing house, Ulaanbaatar, Mongolia, pp. 106.
- Walsh, J. S., 1987. Comparison of NOAA AVHRR Data to Meteorological Drought Indices. Photogrammetric Engineering and Remote Sensing, 53(8), 1069-1074.