| GISdevelopment.net ---> AARS ---> ACRS 2000 ---> Hazard Mitigation |
Visualization of Water Levels
from JERS-1 SAR Images Using Strong Scatters- Phitsanulok, Thailand
Takako
Sakurai-Amano
Invited Scientist, Earth Observation Research Center/NASDA
1-9-9 Roppongi, Minato-ku, Tokyo, 106-0032
TEL: +81-3-3224-7021 FAX: +81-3-3224-7052
E-mail: takako@eorc.nasda.go.jp
JAPAN
KeywordsInvited Scientist, Earth Observation Research Center/NASDA
1-9-9 Roppongi, Minato-ku, Tokyo, 106-0032
TEL: +81-3-3224-7021 FAX: +81-3-3224-7052
E-mail: takako@eorc.nasda.go.jp
JAPAN
GIS, Remote Sensing, Warning and Forecasting, Financial and Administrative Arrangements.
Abstract
We recently developed a method for detecting and visualizing narrow rivers in Amazon forests from 3-look JERS-1 SAR images using isolated strong scatterers. In this study, weextend this concept to flood-stricken regions and examine whether we can detect the rise in thewater level of narrow water channels prior to large-scale flooding. If we can monitor the arearegularly by L-band SAR, our method can be used as to warn against flooding danger on a regional scale. We apply the method to a series of thirteen 4-look JERS-1 SAR images of a Thai rice-growing area observed between February 19, 1995 and August 18, 1998. The results are: Rain zones can be detected as diffuse bright areas; Many water channels that are not visible in dry seasons become visible in rainy seasons. This means that the rise in water level can be observed before the land is actually flooded.
1. Introduction
SAR can be used to observe flooded areas even in bad weather. However, current methods in SAR image interpretation rely on the detection of substantial changes in the size of very dark open water areas or bright under-the-canopy water areas, meaning that flooding can be detected only after the fact.
We have recently developed a method for detecting and visualizing narrow rivers in Amazon forests from 3-look JERS-1 SAR images. This method takes advantage of the spatial pattern of very strong scatterers lined up intermittently (a few hundred meters apart) along the radar-facing shoreline (Sakurai-Amano et al, 2000a). We applied the method to detect the seasonal water levels of tropical forests in the Amazon and Zaire using 4 look JERS-1 SAR images (Sakurai-Amano et al. 2000b and 2000c)
In this study, we extend the original idea to a flood stricken area where there are many man-made objects, though in certain cases the method suffers from the interference from them. We investigate whether we could detect the rise in the water level of narrow water channels prior to large-scale flooding. We then apply the method to a series of thirteen 4-look JERS-1 SAR images of a Thai rice-growing area.
2. Method
Our method consists of the following three steps:
- Speckle reduction. Combining the SFP filter and the enhanced SFP filter, we can preserve very dark features and bright small features, while reducing speckle noise in general (Sakurai-Amano and Iisaka,1999). The user specified constant of the Enhanced SFP filter for level 2.1 JERS-1 images was set to 6000, a slightly lower value than the peak values of the histograms. The constant k for integrating two SFP filtered images was set to 5800.
- The Moving sum of absolute differences is taken between each pixel and its surrounding pixels. Thus we can emphasize isolated strong scatterers.
- Low pass filtering to visualize waterways. We could say that the resulting images show densely populated areas of isolated strong scatterers (hereafter we call the images "isolated scatterers' maps"). These areas are the narrow open rivers in tropical forests. In this paper's case, they may be rivers and flooded areas.
3. Data
We used thirteen level 2.1 JERS-1 SAR images (© MITI/NASDA) observed between February 19,1995 and August 18,1998 and two corresponding JERS-1 VNIR data (© MITI/NASDA) of Phitsanulok, Thailand (D128-272, Descending Path=128, Row=272). Large rice fields in the northern Thai plain surround Phitsanulok, about 380 km north of Bangkok.
4. Results and Discussion
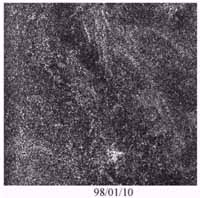
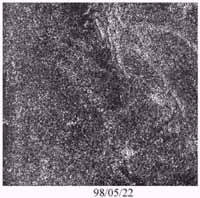
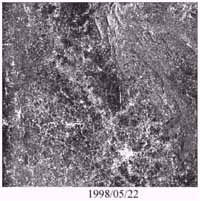
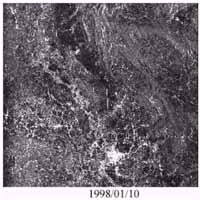
Examining all thirteen images, we find that the rainy season's SAR images have more bright scatterers than the dry season's images, as shown in Figure 1. In the rainy season, many right angled objects of bright material along or near rivers are surrounded by flood water, the image resulting from the rising and bounce back of the specularly reflected microwave from the water surface to the satellite antenna. However, floods and the river water rise cannot explain the relatively even increase of the scatterers through the entire scene. Our interpretation is that since this is an area of natural drainage, water stays on the ground after rain for some time, and therefore millions of tiny water pools are created during the rainy season, each only a few m 2 and with a depth of less than a few cm. These tiny water pools in front of the objects with right orientation also specularly reflect microwaves, and so the objects bounce microwaves back to the satellite. The rainy season's SAR images of this area are therefore brighter than dry season's images.
Figure 1 shows SAR images of the entire scene of D128-272 near Phitsanulok, observed on January 10,1998 and May 22,1998. We selected those two images as examples of images of dry seasons and rainy seasons respectively. The city of Phitsanulok appears as a very bright area almost at the center of the bottom of the images. There are mountain ranges at the center top and right of the image. We see bright inundated wooded areas along the winding river flowing nearly vertically through the city and a tributary bending to the right near the city to a mountain range. Most of the other areas are rice fields.
 |
|
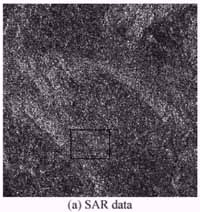
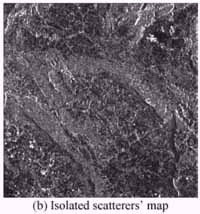
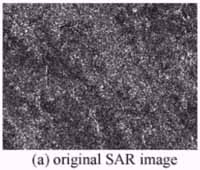
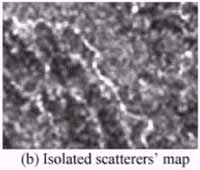
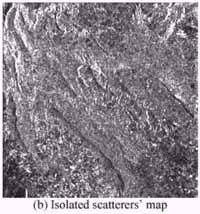
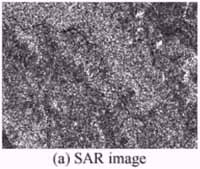
Examine the SAR image in more detail. Figure 2(a) shows the original SAR of the upper right (North East) quarter of the entire D128-272 scene observed in January, 1998. Figure 2(b) is the isolated scatterers' map of the corresponding area. While we can easily see a winding river in the lower half of the scatterers' map, it is not very easy to detect the corresponding river in the original SAR image because the various terrain covers have different backscattering intensities. The isolated scatterers' map, shown in figure 2(b), reduces the differences in ground cover. Mountain ridges are still visible on the map but there are substantially reduced bright areas compared to those in the original SAR images.
 |
|
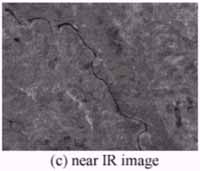
Figure 3 shows the full resolution images of the rectangular area marked in figure 2(a). Since the width of the river is about ~50m as estimated from VNIR data, we can detect the river in the original SAR image visually. However, we can easily detect the river in the map as the brightest winding linear feature that closely corresponds to the river in the near IR image of the VNIR data (see figure 3(c)), although the map also shows extra bright features.
 |
 |
| |
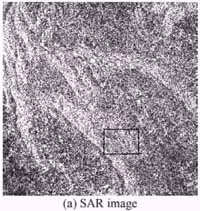
Figure 4 shows the upper-right-quarter of the SAR image observed in May 1998. Both the SAR image and the corresponding scatterers' map are brighter everywhere when compared to those of January, as previously mentioned.
 |
|
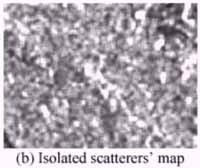
Figure 5 shows the full resolution images of the area shown in Figure 3 (also arked in figure 4(a)). There is no corresponding VNIR data. In this case, the river appears more clearly and slightly wider against the bright background in the SAR image, although we cannot easily see the entire water level picture. On the other hand, we cannot easily distinguish the river from the surrounding area in the scatterers' map because scatterers are everywhere and rivers do not particularly stand out in such situations. However, we can easily grab the entire picture of water level rises from the isolated scatterers' map.
 |
|
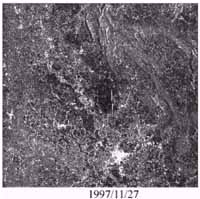
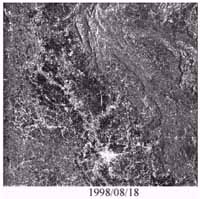
Figure 6 shows the scatterers' maps from November 27, 1997 to August 18, 1998. Those maps roughly indicate the water levels during this period. Examine the lower left quarter of the images. The number of bright fine features slightly increases from November to January and February. But these features increase significantly in May, indicating that the rainy season has begun. In July, the background becomes brighter and some very dark areas appear, indicating that the water gathers to lower places. In August, most of the bright fine features are gone. We interpret this to mean that water levels in narrow channels are lower than that in July, although it is still raining.
5. Conclusion
We can roughly estimate water levels in narrow channels and wet areas of Thai rice-growing areas from JERS-1 SAR images using isolated strong scatterers' maps. Although original SAR images may be better for examining water levels on a pixel-by-pixel basis in certain conditions, the isolated scatterers' map is superior for grabbing the entire water level picture at one time. We expect that the regional scale estimate for water levels could easily be obtained using these isolated scatterers' maps.
6. References
- Sakurai-Amano, T., Iisaka, J., and Takagi M., 2000a. Detection of Narrow Open-water Channels from JERS-1 SAR Images of Amazon Forests. In: Proceedings of SPIE's Second International Asia-Pacific Symposium on Remote Sensing of the Atmosphere, Environment, and Space, 9-12 October 2000, Sendai, Japan.
- Sakurai-Amano, T., Nakasugi, and Takagi, M., 2000b. Detection of Seasonal Water Levels in Amazon Forests from JERS-1 SAR images. In: Proceedings of Japan Society of Remote sensing, November, 2000, Nara, Japan.
- Sakurai-Amano, T., Yoshioka, T., and Takagi, M., 2000c. Dry and wet season water levels in Zaire detected from JERS-1 SAR images. In: Proceedings of Japan Society of Remote sensing, November, 2000, Nara, Japan.
- Sakurai-Amano, T., and Iisaka, J., 1999. Speckle Reduction of SAR images for small Feature Extraction. J. Japan Soc. of Photogrammetry and Remote Sensing, Vol.38, N0.3, pp.32-43.
 |
 |
 |
 |
 |
|