| GISdevelopment.net ---> AARS ---> ACRS 2000 ---> Hazard Mitigation |
High Resolution Remote
Sensing Data & GIS Techniques in Updation of Infrastructure Details
for Flood Damage Assessment - A Case Study
YK Srivastava, Binod
Doley*, DK Pal, RK Das**, S Sudhakar, S Adiga *** KV Venkatachary***, SK
Srivastava***
Regional Remote Sensing Service Centre, ISRO,
Department of Space, IIT - Campus, Kharagpur - 721 302,
West Bengal, India, Phone: (O) 91-3222-55644, (R) 91-3222-78225,
Fax: 91-3222-77210, E-mail: srivastava_yk@yahoo.com
* SRF in Indian Agricultural Research Institute, New Delhi, India.
** Presently working under government of Botswana.
***Department of Space, ISRO Headquarters, Bangalore, India.
KeywordsRegional Remote Sensing Service Centre, ISRO,
Department of Space, IIT - Campus, Kharagpur - 721 302,
West Bengal, India, Phone: (O) 91-3222-55644, (R) 91-3222-78225,
Fax: 91-3222-77210, E-mail: srivastava_yk@yahoo.com
* SRF in Indian Agricultural Research Institute, New Delhi, India.
** Presently working under government of Botswana.
***Department of Space, ISRO Headquarters, Bangalore, India.
Infrastructure, GIS, Remote Sensing, Flood Damage, Brahmaputra River, Disaster, IRS -1C /1D, LISS -III, PAN
Abstract
There are several natural disasters occurring throughout the world round the year and causing huge loss to the lives, property and natural resources. Assessment of damage caused by these disasters needs to be carried out accurately in minimum possible time frame. Space technology is one of the best-suited means for the assessment of damage brought about by natural disasters. Remote sensing satellites provide synoptic view, repetitive coverage and high-resolution images. This advanced high-resolution sensor technology has provided immense scope to the earth resource scientists world-wide for mapping and analysis of earth surface feature details using Remote Sensing and Geographic Information System (RS & GIS). India is among several countries in the world, which face severe problem of floods every year particularly in the river basin of Ganga-Brahmaputra.
Considering the seriousness of the flood problem, Department of Space / Govt. of India has taken very important step to develop and implement an effective Disaster Management System (DMS). One of major activities under DMS is to provide flood damage assessment and to assist in flood mitigation/ protection work. North - Eastern part of India and especially the Assam State is most prone to flood due to its delicate geographic location in the Bramhaputra valley. The mighty river Brahmaputra travels approximately 720 km in Assam from east to west with its perennial flood menace during monsoon that affects almost 20 districts out of a total 24 districts in the state of Assam. Marigaon district of Assam, which is taken as the case study is one of the worst affected districts. Almost 60 % of the district get inundated during flood season causing untold human sufferings and heavy loss to animal lives, property and natural resources worth several million rupees. Indian Remote Sensing Satellite (IRS) - 1C / 1D high resolution PAN, LISS- III, WiFS data and topographic maps on 1: 50,000 scale are used in carrying out this study. Initially digital map database is prepared for geometric rectification of PAN, LISS- III and WiFS data. Further this map database is utilised in digitizing infrastructure details. Merged products of PAN+LISS- III are generated and used for extraction of infrastructure details in GIS environment, i.e., settlements, metal and unmetal roads/ cart tracks, rails, embankments/ dykes and causeway. Apart from infrastructure details, natural features were also digitized, i.e., drainage, ox-bow lakes, streams, river, river islands, tanks and reserve forests boundaries. WiFS data is used for extraction of flood layer and the resultant flood layer is used along with all infrastructure layers to intersect the inundated area and assess the damage. Classified landuse/ landcover (level III) map generated from LISS - III data is used to assess the damage to agricultural crops.
1. Introduction
Almost all the countries in the world are prone to one or more forms of disasters viz. earthquakes, cyclones, volcanic eruptions, drought, landslides, flood etc. India is among several countries in the world that faces multiple facets of such disaster almost every year. The region, facing floods during monsoon is often subjected to severe drought during lean season. Northern and North-East part of India which fall under Bramhaputra - Ganga river basin is prone to floods. Floods in these areas directly or indirectly affect the economy of the country either in the form of natural resources, lives, property or infrastructures such as houses, roads, railways, pipelines, electricity and telecom network.
Bramhaputra River is among the largest rivers in the world. This river originates from the glacier of east Manasarovar and travels nearly 1100 km across the Tibet before entering in India through the eastern part of Arunachal Pradesh. After another 226 km of mountainous journey in Arunachal Pradesh, this mighty river enters in Assam State near Pasighat and travel 720 km in the state from east to west direction and finally leaves Assam at Dhubri district to enter Bangladesh. Bramhaputra River is almost 2880 km long from its origin to out falls in Bay of Bengal. Floods in Brahmaputra River have been aggravated due to frequent change in river course, bed topography and heavy sedimentation load. As reported by the state Govt. that during August - September 1998 people of Assam State have experienced one of the most devastating flood conditions after 1950. This flood had affected a total of 50,000 population, 16,000 houses in 5,126 villages of 21 districts and claimed nearly 156 lives and inundated 2.21 lakh hectares of crop area for about two weeks (DMS Report phase-1 January1999).
In recent years, this has been observed and proved that the space technology is the only means for the mapping, analysing of flood affected area and for providing earliest information to various agencies for carrying out relief rehabilitation measures and for restoration of normalcy. Because, today remote sensing satellites are equipped with high-resolution sensors that can provide finer details of ground with synoptic view and repetitive coverage (Venkatachary KV et al 1999).
Disaster Management System (DMS) conceived by the Department of Space / Govt. of India has been playing a very important and effective role towards flood damage assessment and providing assistance in flood mitigation/ protection work. Infrastructure details on 1: 50,000 scale topographic maps particularly in these areas where floods and migration of river channel are very common, are invariably out dated and over a period of 30 -35 years no updation has been done. If updated, these details can play very important role in assessment of damage. It is very difficult to assess the damage in total without having current information of infrastructure details. Therefore it was decided under DMS project to obtain current information of the infrastructure details using both existing maps on 1:50,000 scale as preliminary base and high resolution panchromatic remote sensing data of IRS - 1C /1D for updation of such details. IRS - 1C /1D, LISS - III data are used for generation of landuse / landcover map for assessment of crop damage. The present study has been carried out with following objectives.
- To assess the utility and capability of IRS 1C / 1D high resolution data for mapping of infrastructure details such as metal and unmetal roads/ cart tracks, settlements, railways and causeways.
- To monitor changes in natural feature using existing topographic maps and IRS 1C / 1D high-resolution data.
- To undertake damage assessment of 1998 flood.
2. Study Area
Marigoan district of Assam State is taken up for this study as this district is severely affected by the floods almost every year. It is covered in 7 topographic maps on 1:50,000 scale and has an area of 1522 Sq. km. The general climate of the district is hot and moist except in the months of December and January. The average temperature of the district is 350 C with an average humidity of 70% - 80% but in peak summer temperature rises to 370 - 400 C during May-June. The average annual rainfall is about 200 cm.
3. Data Used
- IRS -1C, LISS -III data path / row no. 111/53 of 19 February &18 December, 1998
- IRS -1C PAN data path / row no. 111 /53 B & D of 28 March, 1998
- IRS -1C WiFS data of 8 September, 1998
- Topographic maps on 1:50,000 scale
- Village boundary map
In the present study digital image processing has been carried out using ERDAS IMAGINE and EASI/ PACE image processing software. The former is used for creation of digital map database, rectification of PAN, LISS -III, WiFS data, while the later is used for classification of LISS - III data and fusion of LISS -III+ PAN data. Digitization of infrastructure layers, natural features and integration of thematic layer with satellite data is carried out using ARC/ INFO software.
4.1 Preparation of Digital Map Data Base
A digital map database is created on 1:50,000 scale topomaps covering Marigoan district using 200 Dots Per Inch (DPI) with corresponding resolution on maps 0.127 mm which is equivalent to 6.35 m on the ground. Though at least 400 DPI is recommended but keeping in mined the computer memory space requirement with respect to 400 DPI and the utility of digital map database, 200 DPI has been accepted as a trade-off. Moreover, 200 DPI corresponds to a spatial resolution of 6.35 in the ground (Das RK et al 1999). This database fulfill the requirement of compatibility with IRS -1C PAN data of 5.8 m. All digital maps are geo corrected and mosaiced and one uniform base is prepared for district extraction and digitization of infrastructure and other details for updation and change detection.
4.2 Geometric Rectification of IRS -1C PAN and LISS- III Data
Pixels of raw / unrectified satellite image does not have appropriate geometry and uniform scale hence it cannot be used for mapping purpose. After rectification process is performed, each pixel in the image can be referenced not only by its row and column position but also in degree, feet or meter in a standard map projection system. There are several ways and techniques to convert raw image into map but where micro or sub micro level mapping has to be carried out using high-resolution images, it is advantageous to rectify satellite image using Ground Control Points (GCPs) from large-scale topomaps as base for rectification.
Digital map database has been used for the geometric rectification of IRS -1C PAN data. A second degree polynomial model is utilized to establish the transformation between the image and map leading to Root Mean Square Error (RMSE) of about 35 m (which is 15 -25 m with respect to GCP). Each GCP is taken on cultural features, because cultural features are unlikely to change in course of time. Two IRS -1C PAN scenes are used in this district which are geometrically rectified and then mosaiced for district image extraction and updation. These rectified PAN scenes are utilized as base for rectification of LISS - III data.
4.3 Fusion of IRS -1C PAN + LISS - III Data
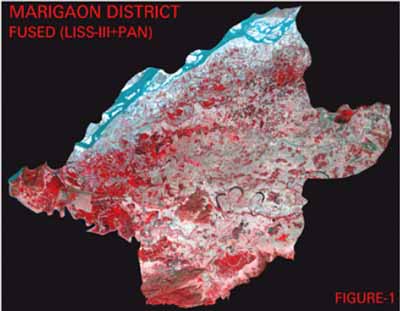
The advancement in digital image processing has provided additional tools such as data fusion or data merging. IHS to RGB transformation method is used for the fusion of two different sensor data. This method delivers best color output by merging high-spatial resolution single band black & white data with low-resolution multispectral data. Here, in this study IRS -1C PAN (electromagnetic spectrum range 0.50 - 0.75) single band black & white data with 5.8 m spatial resolution and IRS -1C LISS - III multispectral data with 23.5 m resolution are used for fusion. Spatial resolution of both PAN and LISS - III data are rounded off to 6 m and 23 m respectively for calculation of scale factor. LISS - III sensor (electromagnetic spectrum range 0.52 - 1.70 micrometer) have 4 bands, i.e., band 1 - Green, 2 - Red, 3 - Near Infrared and band 4 - Short wave Infrared. As short wave infrared band with very coarse spatial resolution is not useful for mapping of infrastructure details hence band 1,2,3 are taken for fusing with PAN data. The fused/ merged output is in 6 m resolution with three RGB viewing image channels (Figure-1).
4.4 Digitization of Infrastructure/ Natural Feature Details
Infrastructure details which are required to be updated such as settlements, road network (unmetal & metal), railways, embankments/ dykes, etc., are digitized in ARC / INFO software environment using digital map database. Other than infrastructure natural features such as reserve forest boundaries, drainage, water bodies, river islands, etc., are also digitized to study the changes occurred in last 30 to 35 years. Separate layer is prepared for each feature with assigning proper attributes.
4.5 Updation of Infrastructure/ Natural Feature Details
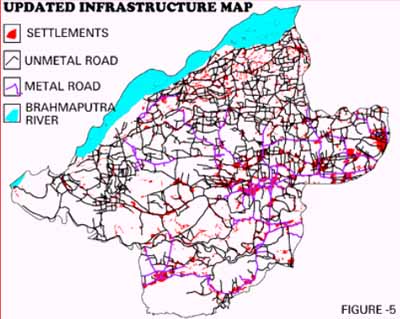
All the layers digitized using digital map database are overlaid on fused image with 6 m resolution (FCC) and changes are incorporated in respective layers (Figure- 5). During the process of updation, it has been experienced that some features that are linear in nature can be updated using single band PAN data. But complexity arises when features are non-linear and there is possibility of mixing with other features. PAN data has various tones of black & white and some times it is very difficult to fix the boundaries between one object and the other. Whereas fused data offers more shades of color and enable the interpreter to separate out subtle differences in objects because of change in color tone. It may be noted that human eye can distinguish easily more shades of color than shades of gray tone in black & white. Therefore, it can be safely stated here that fused data is always more useful than black & white PAN data for mapping of such details if multispectral data of high-resolution is not available.
4.6 Preparation of Flood Layer
Generally SAR data is used for preparation of inundation flood layer, since getting cloud free optical RS data during monsoon season is difficult. It is a coincidence that cloud free data of IRS 1C WiFS data was available. RADARSAT data, which is being used under DMS study for flood inundation layer is very costly as compared to IRS 1C WiFS data. Therefore, an attempt has been made to use WiFS data for preparation of flood inundation layer. WiFS data has spatial resolution of 188 m with 810 km swath. WiFS image covers a vast area of 810 km stretch would have needed huge amount of digital map database for rectification. Hence rectified LISS - III data is used for the rectification of WiFS data. Another aspect is of its resolution; WiFS data does not contain finer details of which cultural features are normally used as GCP for rectification. After rectification, two bands WiFS data is segmented to create flood layer and this is used to report damage for the individual districts. A single WiFS scene covers the entire Brahmaputra valley in the state of Assam.
4.7 Landuse / Landcover Map Generation
Process of generating landuse/ landcover map is done by classifying each pixel of image through assigning training areas about different features that are sought to be classified. MXL supervised classification technique is used in this study for classification of IRS - 1C LISS - III two season data. Main objective of generation of landuse/ landcover map and use of two season data is to assess the damage caused by floods to standing crops.
4.8 Flood Damage Assessement
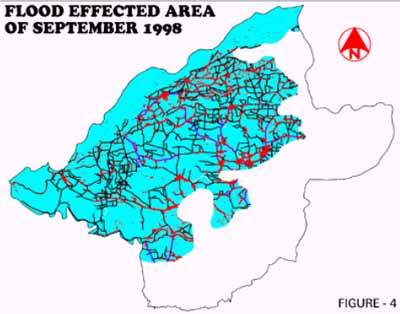
Flood inundation layer extracted from WiFS data is intersected with landuse/ landcover map for agricultural area and infrastructure layers for assessment of damage. The derived result shows that an area of 915 sq. km was inundated during 1998 flood. This includes an agricultural area of 51,068 ha. During two weeks inundation has affected 28,028 ha crop area and other infrastructure such as road network and settlements. (Figure- 4).
5. Results and Discussion
National highways, metal/ unmetal roads are very well detectable on the fused image except those areas where these features are surrounded by the thick vegetation cover. In some places where unmetal roads are narrow and curved, resembled like cart tracks. Therefore, limited ground verification is essential. Railway tracks are clearly visible, as they are straight. Mapping of embankments/ dykes is not very difficult, as they are located beside the banks of the river or big water reservoir. Often they become part of the road network as metal/ unmetal roads are laid over them. Natural features like forest, river, water tanks, oxbow lakes and drainage network have very sharp boundaries hence they are mapped very well.
Mapping and monitoring with reference to infrastructure details, it is worthwhile to mention that today remote sensing, GIS and digital image processing have emerged as powerful tool. No doubt, the way this technology is advancing it is going to play very effective role for real time mapping and analysis of such natural disasters. In 30 - 35 years so many changes have taken place in this district either in form of change in river course or infrastructure (Figure 2, 3 A & B), but local authorities are still dependent on existing topographic maps which are absolutely out dated. If these maps are updated, several aspects of management by the concerned departments can be streamlined. The experience reveals that no other cost-effective inputs are available at present for carrying out such work. Therefore IRS -1C /1D high-resolution images are best suited in context with mapping and monitoring of damage caused by natural disasters. The utility of Remote Sensing and GIS has been realized and people are switching over to this space technology instead of using age-old techniques for mapping and management of natural resources. High-resolution Remote Sensing data and GIS help in integrating multi-parameter spatial information for generating locale-specific plans (Kasturirangan K 1995). Some important infrastructure details that are derived from the study are presented in Table 1.
| Sl. No. | Infrastructure Details | Derived Results | Inundated during 1998 flood | Engulfed by the Bramhaputra River* |
| 1 | Road metal | 269 km | 86 km | 42 km approx. |
| 2 | Road unmetal | 1723 km | 1055 km | 138 km approx. |
| 3 | Total villages | 662 | 414 | 59 |
| 4 | Settlement area | 190 sq. km | 87 sq. km | 30 sq. km |
| 5 | No. of Islands | 17 | ||
| 6 | Area of Islands | 13 sq. km | ||
| 7 | Area under RF | 80 sq. km | ||
| 8 | Area of District | 1522 sq. km | ||
| 9 | Area affected | 915 sq. km |
* Remote Sensing satellite data of 1998 shows that Bramhaputra River has changed its course during the period of 30 - 35 years. It has shifted 114.6 sq. km inside of Marigoan district. This has resulted in engulfing of above infrastructure details which are present in the topomaps surveyed in 1965 -67.
Acknowledgements
The first author is very much grateful to Dr V M Chowdhary, Mr. A Mondal, Mr.S K Tumala, Mr. S K Paul, Dr Kalpana Tiwari, Mr. K Rajesh and Mr. D. Chakraborty Scientists of RRSSC - Kharagpur for their support and help. Mr. Uday Kumar, JRF is also acknowledged for his support in various stages of the study.
References
- Binod Doley and YK Srivastava (January 2000) "Remote Sensing and GIS techniques in updation of infrastructure detail for flood damage assessment of Marigaon district, Assam" M.Tech. Project report, BIT, Ranchi, India.
- Kasturirangan K (1995) "Remote Sensing in India - Present scenario and future thrusts" Photonirvachak. Vol. 23. No. 1
- Venkatachary KV, Rangarajan S, Nageswara Rao PP and Srivastava S K (1999) "Remote Sensing Application for Natural Disaster Management: Retrospective and Perspective" ISRS National Symposium and Remote Sensing Application. Bangalore, India.
- Project Report of Task Force on Damage Assessment due to flood in Brahmaputra Basin in Assam State (phase -1), January 1999,DMS office, ISRO Bangalore. India.
- Das RK, Mondal A, Paul SK, Pal DK and Srinivasa Kumar T. (1999) "Mapping of some infrastructure details from IRS IC/ ID high resolution images for Lakhimpur District of Brahmaputra valley -an Experiment". INCA conference, Goa, India
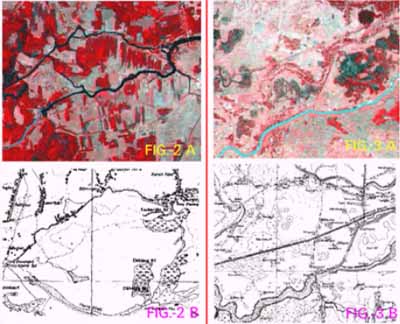
Figures 2A and 3A are current satellite data showing changes in natural and infrastructures with compare to topographic maps (Figures 2B and 3B) surveyed in 1965 - 1967.