| GISdevelopment.net ---> AARS ---> ACRS 2000 ---> Hazard Mitigation |
Validity Study of EDES
Application to Taiwan Chi-Chi Earthquake Disaster
Masayuki KOHIYAMA, Haruo
HAYASHI, Norio MAKI, Shin HASHITERA
Earthquake Disaster Mitigation Research Center, RIKEN
2465-1 Mikiyama, Miki, Hyogo, 673-0433, Japan
Tel: (81)-794-83-6623 Fax: (81)-794-83-6695
E-mail: kohiyama@miki.riken.go.jp
KeywordsEarthquake Disaster Mitigation Research Center, RIKEN
2465-1 Mikiyama, Miki, Hyogo, 673-0433, Japan
Tel: (81)-794-83-6623 Fax: (81)-794-83-6695
E-mail: kohiyama@miki.riken.go.jp
Damaged Area Estimation, DMSP/OLS, Radiance Calibration, Taiwan Chi-Chi Earthquake Disaster, Electric Load
Abstract
The authors are developing the Early Damaged Area Estimation System (EDES), which provides the information as to the estimated impacted areas after any significant earthquake based on nighttime lights observed by the Defense Meteorological Satellite Program (DMSP) Operational Linescan System (OLS). The estimation method is based on the detection of significant reductions or loss of lights in nighttime images following the event, for it can be expected that city lights will observably decrease after a large earthquake. In the 1999 Taiwan Chi-Chi Earthquake Disaster, there was a countrywide power cut due to the damage of the transmission facilities in Chungliao and Tienlun. The post-event image seems to reflect this influence in appearance compared with a pre-event image, but the further investigation is needed because the gain setting of OLS changes along with lunar phase and elevation, and visible-near infrared (VNIR) band imagery only provides relative light intensity. This paper presents a new method to estimate damaged areas based on a radiance-calibrated image and a method to estimate gain and radiance of observed VNIR imagery, and the validity of the estimation result of EDES application to the Chi-Chi Earthquake is discussed using the electric load data before and after the earthquake.
1. Introduction
In order to support emergency response after an earthquake, we are developing the Early Damaged Area Estimation System (EDES), which disseminates spatial information of estimated damaged areas using Defense Meteorological Satellite Program (DMSP) Operational Linescan System (OLS) nighttime imagery (Hayashi et al., 2000). The estimation method is basically based on significant test of lights decreases more than normal fluctuation. But the sensor gain of OLS is controlled to generate consistent imagery of clouds at all scan angles for air navigation of United States Air Force, and the gain values are not open to the public. OLS visible-near infrared (VNIR) images are observed with different gain values in the different moon situations, and their digital numbers (DNs) only provide relative light intensities in the same observed scene. For all that, it can be assumed that the gain setting is almost the same in a similar moon situation, and we proposed image selection criteria to compare a pre-event image (PreI) and post-event image (PostI) (Kohiyama et al., 2000).
2. Nighttime Images before and after Chi-Chi Earthquake
Heavy typhoon clouds covered Taiwan Island around the earthquake onset day, and we chose the image on September 23, 1999 (lunar age: 13.6), which has little cloud influence, to detect lights reductions. As a-month-before images all have cloud contamination, the July-24-1999 (lunar age: 11.4) image was selected as a PreI. DMSP passed over the center of Taiwan (23.8 o N) at 20:47 on July 24 and at 20:09 on September 23, respectively. Fortunately, this 38- minute time lag makes lunar elevations of two images more similar. Figures 1 and 2 show the VNIR PreI and PostI ranging from 15 o N to 30 o N latitude and from 115 o E to 130 o E longitude. Thermal infrared (TIR) band images are shown in figures 3 and 4.

Figure 1 Pre-event VNIR image (July 24, 1999)
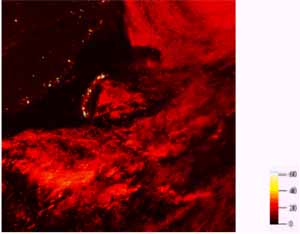
Figure 2 Post-event VNIR image (September 23, 1999)
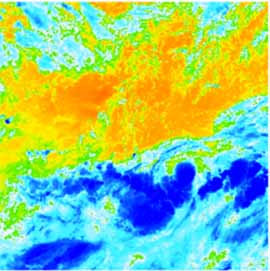
Figure 3 Pre-event TIR image (July 24, 1999)
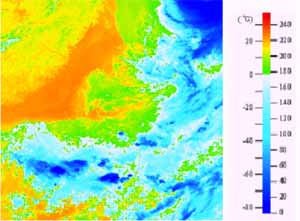
Figure 4 Post-event TIR image (September 23, 1999)
3. Damaged area Estimation using Radiance Calibrated Image
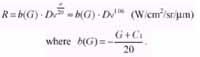
The relationship between the OLS VNIR band gain G (dB), digital numbers DV, and observed radiances R (W/cm 2 /sr/?m) derived from the preflight sensor calibration are depicted by Elvidge et al. (1999). The following equations are derived from the relationship graph:

Equations (1)

Equations (2)
Equation (2) shows the relation between RCI DN DR and radiances R (W/cm 2 /sr/µm). Kohiyama et al. (2000) proposed a method to evaluate a PreI using SLI, but the estimation result corresponds only qualitatively to the result based on an observed PreI. We replicate the method using RCI instead of SLI. The relation DV-DR can be derived from equations (1) and (2):

Equations (3)
We conducted regression analysis to evaluate the DV-DR function using the same sample dataset that was selected in the function evaluation using SLI. The regression curve DV = 0.171DR 1.4 has the correlation factor 0.749, which is greater than that of regression curve using SLI, 0.631. The estimated damaged areas based on the observed PreI, SLI and RCI are shown in figures 5, 6 and 7, respectively. In the figures, red and yellow areas indicate exceeding 97.5 % and 85 % probability points of the normal distribution derived from histograms of DV differences between PreI and PostI. Gray areas show VNIR band saturation in PostI. Estimated results using RCI resembles to that based on observed PreI better than results using SLI especially around Koahsiung.
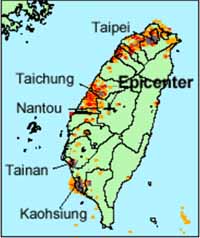
Figure 5 Estimated damaged areas based on observed PreI

Figure 6 Estimated damaged areas based on SLI
Figure 7 Estimated damaged areas based on RCI
4. Electric Load Data Before and After Chi-Chi Earthquake
We obtained electric load (EL) data in Taiwan on July 23 and from September 21 to 23, 1999. The date of pre-event data is different from that of satellite imagery (July 24, 1999), but the difference is enough short to be assumed negligible. The time series data of three aggregation areas are provided as post-event data. As for pre-event data, the time series data of the total system load and peak loads of three aggregation areas are provided. satellite-crossing-time load of each area based on the peak load ratio of each area. Figures 8 and 9 show the EL data before and after the earthquake. The estimated loads are plotted in Figure 8. The aggregation areas of pre-event data shown in figure 10 are different from those of post-event data shown in figure 11.
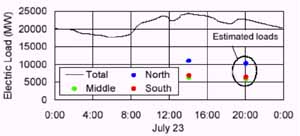
Figure 8 Electric load data on July 23, 1999
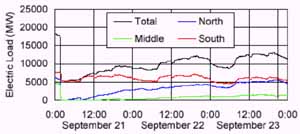
Figure 9 Electric load data from September 21 to 23, 1999
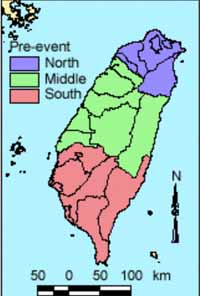
Figure 10 Aggregation areas on July 23, 1999
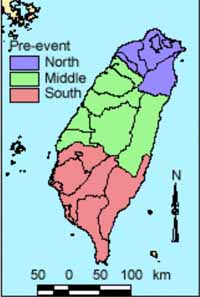
Figure 11 Aggregation areas on September 21 to 23, 1999
5. Gain and Radiance Estimation Method
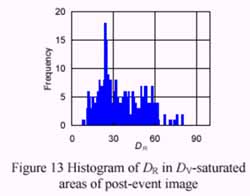
If the observation year of VNIR image is near RCI creation years, that is, there are few changes of light emission source between observed image and RCI, the gain G can be estimated based on DR in edges of Dv-saturated areas (that means Dv equals to 63) using the following equation:
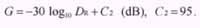
Equation (4)
Generally, Dv saturates in highly urbanized cities and Dv starts to saturate in peripherals of cities. The DR contour lines become longer along with the distance from centers of cities, which should have larger DR. Thus, DR in edges of Dv-aturated areas is the largest in pixel number. This DR can be found as the mode of histogram of DR in areas where Dv equals to 63. When G is given, R can be expressed by Dv from (1) as follows:
Equation (5)
6. Gain Estimation before and after the Earthquake
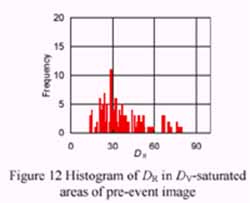
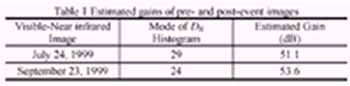
Figures 12 and 13 are histograms of DR in Dv-saturated areas of the PreI and Post I shown in figures 1 and 2, respectively. The area ranging from 30° N to 40° N latitude and from 129° E to 143° E longitude, which covers Taiwan, is excluded from sample datasets to eliminate the earthquake influence. Conditions: DV, DS and DR > 0 are used to select urban areas where DS is DN of SLI. To eliminate cloud influence, a condition: DT > 219 (corresponding to 20° C) where DT is DN of TIR band, is also used. Estimated gains are shown in Table 1.
7. Verification of Estimated Damaged Areas
Figure 14 shows the relation between cumulative radiances (CRs) and ELs in Taiwan. CRs directly calculated from RCI are also plotted with pre-event ELs. Evaluated CR of an observed PreI can be smaller than that of RCI because large radiances cannot be expressed due to DV saturation. Though the north aggregation area become larger in area after the event, the EL become smaller. There was power cut and restriction of power supply due to the damage of the extra-high voltage transmission facilities in Chungliao and Tienlun. The fact that CR becomes smaller proves the lights decrease in this area. Similarly, the south area become larger in area and the EL is smaller after the event. This indicates there was the reduction or loss of lights in Nantou or Hualien County, which are the increment parts of south aggregation areas. These results support the validity of the estimation results of EDES.

Figure 14 Cumulative radiances and electric loads in Taiwan
8. Conclusions
Radiance calibrated nighttime image can be used to evaluate an artificial pre-event image better than stable lights image. Estimation method of gain and radiance of VNIR image using radiance calibrated image is proposed. The relation between the cumulative radiance and electric load in Taiwan before and after the Chi-Chi Earthquake reflects the power cut due to the damage of transmission facilities, and this supports the validity of the estimation results of EDES.
Acknowledgements
We wish to thank National Oceanic and Atmospheric Administration's National Geophysical Data Center for DMSP/OLS images, SLI and RCI, and also Taiwan Power Company for electric load data before and after the Chi-Chi Earthquake.
References
- Elvidge, C. D. et al. 1997, Mapping City Lights With Nighttime Data from the DMSP Operational Linescan System, Photogrammetric Engineering & Remote Sensing, Vol. 63, No. 6, pp. 727-734.
- Elvidge, C. D., et al., 1999, Radiance Calibration of DMSP-OLS Low-Light Imaging Data of Human Settlements, Remote Sensing of Environment, Vol. 68, pp. 77-88.
- Hayashi, H. et al., 2000, International Collaboration for the Early Damaged Area Estimation System Using DMSP/OLS Nighttime Images, Proceedings of IEEE 2000 International Geoscience and Remote Sensing Symposium.
- Kohiyama, M. et al., 2000, Development of Early Damaged Area Estimation System (EDES) Using DMSP/OLS Nighttime Imagery, Journal of the Institute of Social Safety Science, No. 2 (in press, in Japanese).