| GISdevelopment.net ---> AARS ---> ACRS 2000 ---> Hazard Mitigation |
Automated Detection of
Building Damage Due to Recent Earthquakes using Aerial Television
Images
Hajime MITOMI, Fumio
YAMAZAKI and Masashi MATSUOKA
Earthquake Disaster Mitigation Research Center, RIKEN
2465-1 Mikiyama, Miki, Hyogo 673-0433, Japan.
Tel: +81-794-83-6632 Fax: +81-794-83-6695
E-mail: mitomi@miki.riken.go.jp
KeywordsEarthquake Disaster Mitigation Research Center, RIKEN
2465-1 Mikiyama, Miki, Hyogo 673-0433, Japan.
Tel: +81-794-83-6632 Fax: +81-794-83-6695
E-mail: mitomi@miki.riken.go.jp
Image Processing, Building Damage, Texture Analysis, the 1999 Kocaeli Earthquake, the 1999 Chi-Chi Earthquake
Abstract
The characteristics of severely damaged buildings were examined by image processing of aerial television images taken after the 1999 Kocaeli, Turkey and the 1999 Chi-Chi, Taiwan earthquakes. In image processing, color indices and edge elements were used for the extractions of information on damaged buildings. After pixels indicating damaged buildings were detected on the basis of these characteristics, the texture analysis of the image was attempted. The result of the texture analysis was compared with the results of visual inspection. Using this approach, collapsed buildings were properly identified. The automated damage detection method proposed here can be used efficiently in emergency management shortly after a large-scale natural disaster.
1. Introduction
After the 1995 Hyogoken-Nanbu (Kobe) earthquake, the delay of initial measures by central and local governments was pointed out. It is important to estimate and grasp damage situations during the early stage of recovery activity without depending on information sent from the interiors of the stricken area. Several methods for gathering information on damage from outside of the stricken area are available, such as aerial television imagery, aerial photography and satellite imagery. Aerial television images and photographs, which have higher spatial resolution than satellite images, were visually inspected (Hasegawa et al., 2000a; Ogawa and Yamazaki, 2000). Although the severely damaged buildings could be visually inspected, a significant amount of time was required for visual interpretation. Therefore, Koga et al. (1998) and Hasegawa et al. (2000b) carried out preliminary studies on automated damage detection using image processing. In particular, Hasegawa et al. (2000b) examined the characteristics of aerial images of severely damaged wooden buildings taken by high-definition television (HDTV) cameras operated by the Japan Broadcasting Corporation (NHK) after the Kobe earthquake, and we developed a method of automated damage detection based only on the post event images. The damage distribution extracted using the proposed method agreed relatively well with the ground truth data and the results of visual inspection of the HDTV images. In this paper, we report the results obtained by applying the method proposed by Hasegawa et al. (2000b) to the 1999 Kocaeli, Turkey and the 1999 Chi-Chi, Taiwan earthquakes.
2. Damage Detection Method
In the damage detection method proposed by Hasegawa et al. (2000b), the characteristics of damage to wooden buildings were defined based on hue, saturation, brightness (intensity) and edge elements. Using the threshold values of these parameters, the typical areas were classified into damaged and undamaged pixels. Texture analysis was then carried out on these pixels and the damaged buildings were identified. The steps of the automated detection method (described as the Kobe method) are as follows:
- Some training data are selected from typical damaged and undamaged wooden buildings in a HDTV image.
- The intensities of edge elements are calculated by a general gradient filter with a 3 x 3 pixel window and are allocated to one byte (256) value.
- The pixels with the edge intensity value between 32 and 90 are selected.
- The variances in the edge intensity are evaluated for the area of 7 x 7 pixels and are allocated to one byte value for the center pixel.
- The pixels with the variance between 0 and 30 are selected.
- The relative frequencies of color indices such as hue, saturation and intensity (HSI) are also calculated using the RGB values and are allocated values from 0-360 degrees for hue and one byte values for saturation and intensity.
- The pixel, which contains the range of 92-148 degrees (this color range is from red to yellow) for hue, 0-90 for saturation, and 0-175 for intensity, are selected.
- The local density of the selected pixels (described as Rpx) is calculated by texture analysis. For the texture analysis, 31 x 31 to 63 x 63 pixel windows are selected to be proportional to the image scale, depending on the location of the area in the image.
- The pixel blocks whose density values are smaller than 14%, and larger than or equal to 14% are assigned as belonging to undamaged and collapsed buildings, respectively.
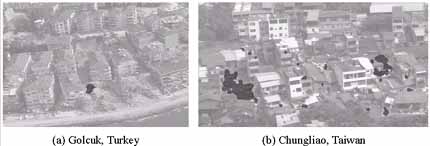
Figure 1: Results of automated damage detection by the Kobe method
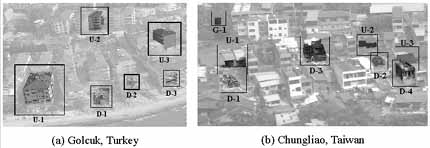
Figure 2: Training data used in this study
The Kocaeli, Turkey and the Chi-Chi, Taiwan earthquakes occurred on August 17, 1999 and September 21, 1999, respectively (Earthquake Disaster Mitigation Research Center, 2000a,b). The Japanese Geotechnical Society captured images of stricken areas, a few weeks after the Turkey earthquake using a digital video camera from a helicopter. Two and four days after the Taiwan earthquake, NHK captured images of severely damaged areas using a HDTV camera from a helicopter. In this study, we used images taken at Golcuk in Turkey and Chungliao in Taiwan, which had suffered severe damage after the earthquakes. We applied the Kobe method to images taken in Turkey and Taiwan, as shown in Figure 1. The damage areas extracted from the Turkey image was much smaller than the actual distribution of damaged buildings, although more accurate information on building debris was extracted in the Taiwan image. Because some factors attaching the images may be different, such as the influence of sunshine, built environment and so on, whereas damage distribution in the case of the Taiwan image may fortunately be similar to the built environment of the Kobe image used by Hasegawa et al. (2000b). We selected training data and threshold values for each image in order to obtain an extracted damage distribution close to the actual damage situation. Figure 2 and Table 1 represent the selected training data and threshold values for each image of the Turkey and the Taiwan earthquakes. In this study, training data were also selected for moderately damaged buildings, such as D-3 in Turkey, D-3 and D-4 in Taiwan. Damaged pixels were then extracted
| Characteristics | Range of threshold values | ||
| Kobe | Turkey | Taiwan | |
| Hue (degree) | 92 - 148 | 0 - 360 | 14 - 148 |
| Saturation | 0 - 90 | 16 - 95 | 25 - 109 |
| Intensity | 0 - 175 | 63 - 176 | 52 - 170 |
| Edge intensity | 32 - 90 | 15 - 103 | 14 - 70 |
| Variance of edge intensity | 0 - 30 | 5 - 77 | 1-25 |
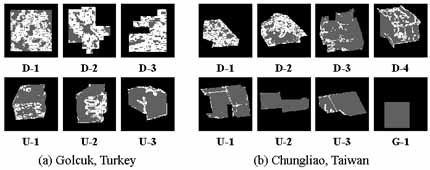
Figure 3: Pixels satisfying the threshold values for the selected small areas in Figure 2. The identified pixels (white area) from each image corresponds mostly to "collapsed" buildings while the shaded gray-color pixels indicate mostly "undamaged" buildings
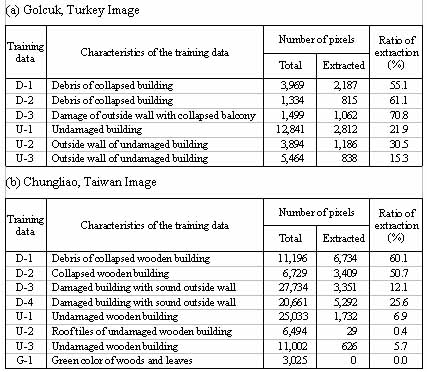
Table 2: Number of pixels and ratio of extraction in the training data of the two earthquakes
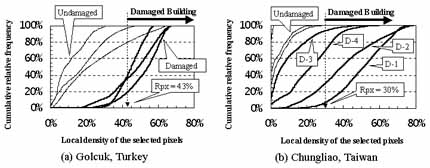
Figure 4: Cumulative relative frequencies versus local density of the selected pixels in a 31 x 31 pixel window for the texture analysis
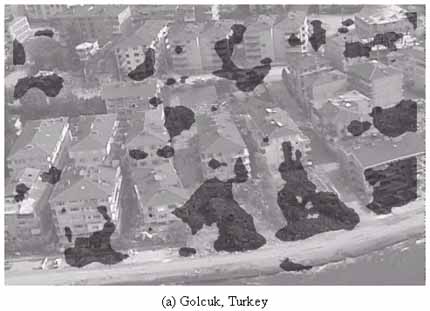
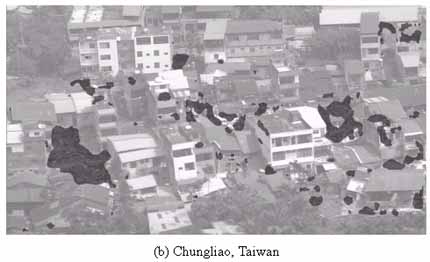
Figure 5: Building damage distribution obtained by the automated detection using the threshold values in Table 1
Automated detection of damaged buildings was carried out by the image processing of aerial images taken after the 1999 Kocaeli, Turkey and Chi-Chi, Taiwan earthquakes. In the proposed Kobe method, characteristics of the damage to wooden buildings selected as training data were defined on the basis of hue, saturation, intensity, edge intensity and variance of edge intensity, and their threshold values were established. A threshold value for a texture analysis was also determined for estimating the distribution of damaged buildings, after the damaged pixels were extracted. The damage distribution obtained by the Kobe method for the Turkey image was not in particularly good agreement with the actual damage scale, although the result of the Taiwan image was not so bad. We found that it was difficult to use the same threshold values for all the images because of the difference in some factors, such as the influence of sunshine, built environment, and so on. Therefore, the different threshold values for the image characteristics and the texture analysis were estimated for each image. The distribution results for the extracted areas were better than those obtained by the Kobe method.
The distribution of severely damage buildings was estimated by the image characteristics and texture analysis, whose threshold values were empirically determined. In order to establish more general methodologies and threshold values, the authors intend to perform further case studies in the near future.
Acknowledgments
The digital video images and the HDTV images taken in Turkey and Taiwan were provided by Dr. N. Yoshida of Sato Kogyo Co., Ltd., and the Japan Broadcasting Corporation, respectively.
References
- Earthquake Disaster Mitigation Research Center, 2000a. Report on the Kocaeli, Turkey Earthquake of August 17, 1999, EDM Technical Report, No.6.
- Earthquake Disaster Mitigation Research Center, 2000b. Report on the Chi-Chi, Taiwan Earthquake of September 21, 1999, EDM Technical Report, No.7.
- Hasegawa, H., Yamazaki, F., Matsuoka, M. and Sekimoto, I., 2000a. Extraction of Building Damage due to Earthquakes Using Aerial Television Images, Proceedings of the 12th World Conference on Earthquake Engineering, No. 1722, CD-ROM.
- Hasegawa, H., Aoki, H., Yamazaki, F. Matsuoka, M. and Sekimoto, I., 2000b. Automated Detection of Damaged Buildings Using Aerial HDTV Images, Proceedings of the IEEE 2000 International Geoscience and Remote Sensing Symposium, IEEE, CD-ROM.
- Koga, K., Miura, F. and Nozawa, M., 1998. Image Analysis for Damage Estimation of Building due to Earthquake, Proceedings of the 3rd Symposium on the Mitigation of Urban Disasters by Near-Field Earthquakes, pp. 417-418 (in Japanese).
- Ogawa, N. and Yamazaki, F., 2000. Photo-Interpretation of Building Damage due to Earthquakes Using Aerial Photographs, Proceedings of the 12th World Conference on Earthquake Engineering , No. 1906, CD-ROM.