| GISdevelopment.net ---> AARS ---> ACRS 2000 ---> Hyperspectral & Data Acquisition Systems |
Application of airborne
Hyperspectral imaging in Wetland delineation
Chung-hsin
Juan1, Jonathan D. Jordan1, and Chih-Hung
Tan2
1Agricultural and Biological Engineering Department, University of Florida
PO Box 110570, Gainesville, Florida 32611-0570,USA
Tel: +1 (352) 3928030
E-mail: crs@ufl.edu
2 Agricultural Engineering Research Center
196-1, ChungYuan Rd., ChungLi
Tel: (886)-3-4521314
E-mail: chtan@aerc.org.tw
TAIWAN
Keywords:Hyperspectral image, Wetland
delineation, Wetland Vegetation Mapping, Remote
sensing1Agricultural and Biological Engineering Department, University of Florida
PO Box 110570, Gainesville, Florida 32611-0570,USA
Tel: +1 (352) 3928030
E-mail: crs@ufl.edu
2 Agricultural Engineering Research Center
196-1, ChungYuan Rd., ChungLi
Tel: (886)-3-4521314
E-mail: chtan@aerc.org.tw
TAIWAN
Abstract
The study site is located in Fort Drum Marsh, Indian River county, Florida, where the main vegetation types are sawgrass (Cladium Jamaicense) and cattail (Typha domigensis) with some floating vegetation and scattered clusters of bushes and trees. A complete hyperspetral imaging mission for hyperspectral imaging was performed in May, 2000. The mission included the preparation of ground targets and calibration panels, the aerial imaging flight, and the ground truth trip. The mounted hyperspectral imaging sensor has 64 wavebands from 399.2 nm to 920.5 nm. The ground truth work included taking spectral reflectance measurements by a hand-held radiometer, multi-spectral images by a multi-spectral imager, measurements of leaf area indices (LAI) by a LAI meter in the locations where only one interested plant species grew in the surrounding area. After the hyperspectral image was rectified and spectrally calibrated, the pixels of the ground truthing points were extracted from the images and then their spectral reflectances were compared with the ground spectral reflectances acquired by the spectral radiometer. The results demonstrated noticeable differences in the spectral reflectances of different wetland plant species. Therefore, wetland could be delineated into species level using aerial hyperspectral imaging.
1. Introduction
Wetland vegetation species are very sensitive to the environmental changes, and vice versa wetland vegetation species may be a good indicator of the environmental changes. As the concerns of wetland protection grow, wetland delineation is also getting more important. In freshwater marsh, both cattail (Thyha, spp.) and sawgrass (Cladium jamincese) can grow in similar geomorphological and geographical locations and may mix together, but sawgrass tends to be found in lower nutrient level conditions (Kadlec and Knight, 1996). Therefore, the spatial distribution of the cattail and sawgrass in freshwater marshes are monitored by the government agencies routinely. However, both of the species looked very similar from a distance and hardly identified without close observations, and thus wetland delineation to the specie level usually needs more intensive tasks in field trips. In order to save the time and labor consuming filed work in identifying different species, remote sensing was employed as an ideal and convenient tool to serve this purpose (Doren, 1999).
The most frequently used conventional remote sensed data were either satellite images or airborne color infrared (CIR) photos and images (Madden, 1999; Welch, 1996). The satellite data mostly have not enough high spatial resolution to differentiate detailed ground information. Although the airborne CIR photos and images may have enough spatial resolution, they may have too broad spectral wavebands to identify two similar color looking species. Therefore, as to properly delineate wetlands of the study purpose, airborne hyperspectral images would fit the needs in terms of both spatial and spectral resolutions.
The main goal of this study is to use ground-based and airborne remote sensing tools to study the feasibility of delineate wetlands at species level. The mission of the aerial hyperspectral imaging have three stages: 1) Preparations before aerial hyperspectral imaging, 2) Setup during aerial imaging, and 3) Ground truthing.
2. Materials and Methods
2.1 Study Area
The study site is located in the Fort Drum marsh, upper St. John's River basin, in Indian River county, Florida (27E35'12"N, 80E41'17"W, Figure1). It is the headwater of the St. Johns River. The site is a freshwater marsh with cattail and sawgrass as the dominant vegetation species. The desired imaging area with the illustration of the mission plan was also show in Figure 1.
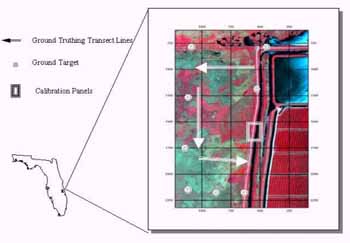
Figure 1. The location of the study site and the illustration of the mission plan.
2.2 Mission Plan for Aerial Hyperspectral Imaging
The employed hyperspectral imager in this study is band-adjustable and can have 128 wavebands in maximum. Due to the limitation of the transfer rate and the storage capacity, to get more wavebands will be traded off by less available imaging area and larger pixel size. In this study, 64 wavebands with the pixel size of 1 meter with a range from 399.2 nm to 920.5 nm were selected.
2.2.1 Preparations of Ground Targets and Calibration Panels Before Aerial Imaging
To utilize the aerial hyperspectral images usually has two main problems of concerns. First, due to the current data transferring speed and storage capacity of storage devices, many hyperspectral imagers are pushbroom imaging systems. Because the instability of the airplane, to keep the imager scanning ground areas exactly along the designated route is difficult and usually results in more possible distortion than fixed-frame imagers (Lee and et al, 2000). Second, the hyperspectral imager measures reflected radiances of ground objects, which may change with respect to incoming radiances and may be hardly compared with other images of the same objects but different light conditions. More useful measuring unit to represent the signatures of measured objects is the ratio of the reflected radiance of an object to the incoming radiance. Therefore, during the aerial imaging, a set of white bright ground targets and a set of calibration panels with different gray levels all the way from visible wavebands and infrared wavebands were necessary to be properly placed in the desired imaging area.
Because the imaging area was a marsh, the ground targets needed to be water-proof, floatable, and anchorable in the marsh. One meter by one meter white foam boards coated with plastic films were used as ground targets, because they were water-proof, floatable and more resistant to bending stress with plastic films. Two wood sticks cross each other were affixed on the back of each white foam board to increase its resistance to winds and waves. A fishing line with 100 lbs resistance was tied up onto the wood frame and linked to a concrete block served as an anchor. An airboat trip was taken in the Ft. Drum Marsh before the imaging day to place the ground targets and record their coordinates using a code differential GPS unit (Model Pathfinder Pro XR, Trimble Navigation, California).
There are few companies that make calibration panels with large sizes and different well-reflected gray shades. Those calibration panels are very nice but sometimes beyond the budgets of research centers at university and local government levels. Therefore, some other alternative materials were used. We examined cloths of their spectral reflectance ratios using a hand-held spectral radiometer (Model GER-1500, Geophysical & Environmental Research, New York) in local textile stores and found out some black, white and white-meshy fabrics with the same reflectance ratios from blue waveband through near infrared wavebands. Then, we sewed those fabrics and attached them on black tarpaulins to make five durable calibration panels with the size of 3.7 meter by 3.7 meter and the relative reflectance ratios of 4%, 10%, 25%, 45%, and 56%, respectively.
2.2.2 Setup for Aerial Hyperspectral Imaging
The preferred imaging day would be on or near the days when the LandSat 7 satellite would visit the study area in order to seek the potential of applying the results of airborne hyperspectral images to satellite images. Usually, spring is less clouded in Florida. Thus, the imaging day was considered around April 25 or May 11, 2000, which days the LandSat 7 satellite would visit on. The calibration panels and some extra ground targets were placed on the dike of the Ft. Drum Marsh before aerial imaging on the imaging day. The imaging was desired to do two different directions in order to avoid the shadows of the airplane and some clumps. One imaging was from north toward south, the other was from west to east.
2.2.3 Ground Truthing
Another airboat trip was made to do the ground truthing. Based upon the results of the unsurprised classification of the 1999 airborne image, there were some classes of that the spectral characteristics were not able to identified. According to the classification of the 1999 image, the desired ground truth points were pre-selected. The actual ground truth points might be changed as the field situations. At each point, first, the geo locations was first measured by the GPS unit. Then, the plants and were identified as well as the growth situation. The spectral reflectance, leaf area indices (LAI) were also measured using the spectral radiometer and a LAI meter (Model SunScan canopy analysis system, Detla-T Devices, Cambridge, England). At and around the ground truth points, digital video images at four narrow wavebands of 550 nm, 698nm, 798 nm, and 850 nm were recorded by a multi-spectral imager (Model MultiSpec Agro-Imager, Optical Insights, Arizona).
3. Results and Discussion
Ten ground targets were placed in the marshes on April 29, 2000. The aerial imaging was performed on May 12, 2000, and the field ground truthing was completed on May 17, 2000. The hyperspectral images were rectified by a piecewise rectification procedure. By observing the straight dike along the flight direction, the hyperspectral image was subset into several images for rectifications using polynomial functions, and then mosaiced together afterwards. By this special procedure, the root mean of square errors was 4.7 meter.
The spectral reflectance ratios of cattail and sawgrass have a little bit but still distinguishable difference (Juan and Shih, 1997). The ground spectral radiometer measurements of several different species was normalized (Tan, 1998) and displayed in Figure 2. The hyperspectral image was spectrally calibrated using the measured spectral characteristics of the calibration panels. The pixels at the ground truthing locations with known vegetation species were exacted and shown in Figure 3. The spectral reflectances ratios of different species were obvious in both Figure 2 and Figure 3 except sawgrass and cattail. In Figure 2, the difference between sawgrass and cattail was noticeable but insignificant, where the difference between sawgrass and cattail was significant. When cattail dies off, the dead leaves fall down and layer above the water surface but not break down at once. Therefore, the aerial images viewing from top to down showed more spectral influence of dead leaves of cattail than the spectral radiometer measurements from the side view.
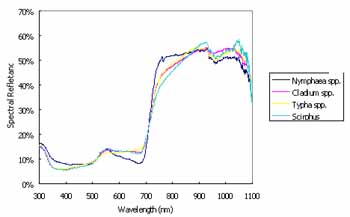
Figure 2. Spectral Refletance Ratios of Different Wetland Vegetation Species Measured by Ground Spectral Radiometer
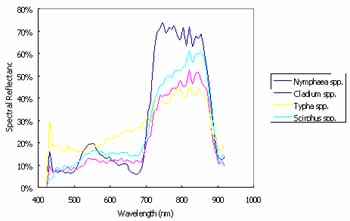
Figure 3. Spectral Reflectance Ratios of Different Wetland Vegetation Species From the Spectrally Calibrated Hyperspectral Image
4. Conclussion and Continuing Work
The aerial hyperspectral imaging was shown to be a considerable technique to delineate wetland. More analysis will be done to evaluate the most sensitive wavebands to identify different plant species. In addition, subpixel classifications from satellite images from the results of the hyperstral images will be also attempted.
5. Ackowledgements
The authors would like to address their appreciations to the Institute of Technology Development, Stennis Space Center, NASA for their kindly offer of the hyperspectral imager and the aerial imaging flight. They'd also like to express their sincere thanks to St. John's River Water Management District the assistance in field trips. Furthermore, we'd like to show our gratitude to Mr. Orland Lanni in the Center for Remote Sensing for his efforts in making the calibration panels. At the end, they'd like to honor Dr. Sun-Fu Shih, the former director of Center for Remote Sensing, who passed away in June, 2000 during the ongoing of this research.
References
- Doren, R. F., K. Rutchey, and R. Welch, 1999. The Everglades: a perspective on the requirements and applications for vegetation map and database products. Photogrammetric Engineering and Remote Sensing, 65 (2) pp. 155-161.
- Juan, C. H. and S. F. Shih, 1997. A Lysimeter System for Evapotranspiration Estimation for Wetland Vegetation. Soil Crop Sci Soc. Florida Proc. 56, pp. 125-130.
- Kadlec, R. H. and R. L. Knight, 1996. Treatment Wetlands. CRS, Boca Ration, Florida, pp. 447 - 448.
- Lee C., H. J. Theiss, J. S. Bethel, and E. M. Mikhail, 2000. Rigorous Mathematical Modeling of Airborne Pushbroom Imaging Systems. Photogrammetric Engineering and Remote Sensing, 66 (4) pp. 385-392.
- Madden, M., D. Jones, and L. Vilchek, 1999. Photointerpretation key for the Everglades Vegetation Classification System. Photogrammetric Engineering and Remote Sensing, 65 (2), p. 171-177.
- Tan, C. H., 1998. Regional Scale Evaptranspiration Estimation Using Vegetation Index and Surface Temperature from NOAA Satellite AVHRR Data. Doctoral Dissertation, Univesity of Florida, pp. 64.
- Welch, R., 1996. GPS, image processing and GIS techniques for coastal wetland mapping applications. International Archives of Photogrammetry and Remote Sensing, 31 (B4) pp. 931-933.