| GISdevelopment.net ---> AARS ---> ACRS 2000 ---> Hyperspectral & Data Acquisition Systems |
Estimation of Photosynthetic
Rate of Plant from Hyper-spectral Remote Sensing of Biochemical
Content
Takahiro ENDO*, Toshinori
OKUDA**, Masayuki TAMURA**, and Yoshifumi YASUOKA*
*Institute of Industrial Science, University of Tokyo
4-6-1 Komaba, Meguro-ku, Tokyo, 153-8503 Japan
Tel: (81)-3-5452-6410 Fax: (81)-3-5452-6415
E-mail: tendo@iis.u-tokyo.ac.jp
**National Institute for Environmental Studies
16-2 Onogawa, Tsukuba, 305-0053 Japan
Keywords: hyperspectral remote sensing,
carbon absorption, photosynthetic rate, chlorophyll,
nitrogen*Institute of Industrial Science, University of Tokyo
4-6-1 Komaba, Meguro-ku, Tokyo, 153-8503 Japan
Tel: (81)-3-5452-6410 Fax: (81)-3-5452-6415
E-mail: tendo@iis.u-tokyo.ac.jp
**National Institute for Environmental Studies
16-2 Onogawa, Tsukuba, 305-0053 Japan
Abstract
Carbon absorption of plant is one of the essential parameters in assessing terrestrial ecosystem functions with respect to global warming. It is, however, not easy to measure carbon absorption directly on the ground. In this study remote sensing method was investigated to estimate photosynthetic rate of plant from the measurement of biochemical content. If net photosynthetic rate may be estimated, carbon absorption and NPP can be predicted. Firstly, we measure the relationship between biochemical concentrations and parameters of "Blackman" photosynthetic model. Secondly, we measure the relationship between biochemical concentration and hyperspectral characteristics. High-resolution reflectance over a range of 333 -2507nm with resolution of about 1.5-10 nm and net Amax (maximum assimilation rate) - photon flux density (PFD) were measured respectively by the GER 2600, LI-6400. Also, chlorophyll a, chlorophyll b, chlorophyll a+b and nitrogen concentrations were quantitatively analyzed from in situ measurement of cucumber's fresh leaves that were cultivated to have different biochemical concentration in a greenhouse chamber. Correlation between saturated Amax and chlorophyll a and nitrogen concentration was r2=0.90, and 0.91, respectively. Both chlorophyll a and nitrogen concentrations were estimated by the first derivative spectral reflectance (RF') of fresh leaf. RF' at 678.011nm correlated best with chlorophyll a concentration (r2=0.81). RF'at 732.122nm correlated best with nitrogen concentration (r2=0.86). Finally, net Amax at given PFD was estimated by the photosynthetic rate model. A correlation between the actual net Amax and the estimated net Amax was r2=0.74.
1. Introduction
In recent years, remote sensing has made a rapid progress in developing methods to estimate of a number of essential forest ecosystem variables, such as leaf area index (LAI), absorbed fraction of photosynthetically active radiation, canopy temperature, and plant community type. These variables are useful for predicting ecological fluxes. Further insights to ecosystem function, such as biochemical fluxes and processing require additional variables. The prospect of biochemical composition of plant canopy is relevant to the potential elucidation of biochemical fluxes, such as nitrogen cycle and carbon cycle components. A kind of terrestrial ecosystem function is descried as an enormous sink of carbon. The terrestrial vegetation can assimilate carbon dioxide, a kind of greenhouse gas, through photosynthesis, which is a basic process for biochemical fluxes. Photosynthetic rate, which is a kind of biosynthesis, depends on biochemical content in leaf and environmental condition, such as temperature, water and light condition. For example, in case of interspecies, a single leaf with high photosynthetic rate has high biochemical concentration, such as chlorophyll or nitrogen concentration.
Estimation of optical and biochemical properties of fresh leaves have been reported, especially using short-wave infrared wavelengths. Lee F. Johnson et al.1. found correspondence between the first derivative spectral reflectance from the Airborne Visible/Infrared Imaging Spectrometer (AVIRIS) and concentrations of both chlorophyll and total nitrogen (R2=0.71 and R2=0.85, respectively) along a vegetation transect in Oregon. Paul J. Curran et al.2. also used the first derivative reflectance of AVIRIS data to predict chlorophyll, nitrogen, lignin, and cellulose concentrations (R2=0.96 R2=0.94 R2=0.93, and R2=0.61, respectively) at a slash pine plantation, Florida.
The objective of this study is to estimate net photosynthetic rate based on physiological parameters. Our study examines whether chlorophyll and nitrogen concentrations could be estimated using spectral reflectance and net photosynthetic rate could be estimated by estimating chlorophyll and nitrogen content at the single leaf in the laboratory darkroom and the greenhouse chamber. We tried to investigate net photosynthetic rate models suitable for remote sensing and to statistically analyze relationship between parameters of photosynthetic rate model and biochemical concentrations of fresh leaves. Finally, the authors estimated the net photosynthetic rate using spectral reflectance of fresh leaves measured by a hyperspectral spectrometer.
2. Photosynthetic Rate Models
2.1. Light-Photosynthetic Rate Curve
At present, several net photosynthetic rate models have been developed based on the physiological properties in the plant physiological studies. There are mainly two groups of models based on either the photon flux density (PFD) or CO2 concentration. One set of models defines PFD as incident light energy, while the other models define CO2 concentration and rate of electron transport system in the leaf. The estimation of net photosynthetic rate of the latter group of models is more accurate than that of the former. But, these parameters can't be directly measured using remote sensing data. Hence, the authors selected the former set of models, such as " light-photosynthetic rate model ".
The light-photosynthetic rate models are mainly three types; (1) the Michaels-Menten type models; (2) the asymptotic exponential equation type models; (3) the Blackman type models3.. Based on a review of the available literature, the Blackman type was the best fit to an actual net photosynthetic rate. The Michaels-Menten type doesn't fit to the actual photosynthetic rate, when incident light energy is low. In case of using the asymptotic exponential equation type, the slope of the curve raises slowly in the region of curve inflexion. The Blackman type model estimated the actual fresh leave's photosynthetic rate more effectively from low incident light energy levels to high incident light energy levels. So, the authors selected the Blackman type.
2.2. Blackman Type
The "Blackman type" estimation model of net photosynthetic rate of a fresh leaf has five parameters. Amax, the maximum assimilation rate same as maximum photosynthesis rate is estimated as in Eq. (1):
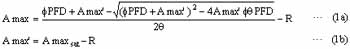
where, Amax [mmol CO2 m-2 s-1] is the maximum assimilation rate, PDF [mmol photon m-2 s-1] is Photon Flux Density, Amax' [mmol CO2 m-2 s-1] is the gross maximum photosynthetic rate, q is the convex value of this model's curve, which stands for the Rubisco activity level. Rubisco is the enzyme that traps CO2 gas from atmosphere into Calvin cycle. F is the initial slope of the curve under low incident level. Amaxsat is the saturation value of the Amax-PFD curve, R [mmol CO2 m-2 s-1] is the respiration rate of flesh leaf.
As a result of literature reviews, Amaxsat and R have high correlation with chlorophyll and nitrogen content. These two parameters can be estimated by hyperspectral characteristics. q and F is said to be within a range of 0.7-0.95 and 0.04-0.06, respectively. But, we used the measured value in this study, as we had the results of experiment.
3. Materials and Methods
3.1. Plant Materials and Measurements of Leaf Reflectance and of Light-Photosynthetic Rate Curve
Cucumber seeds were planted into a plastic pot and maintained for 28days in a greenhouse chamber. These plants were cultivated under two different conditions in order to make leaves with different concentration of chlorophyll, nitrogen, and so on. While conditions for one series was most suitable with regard to light condition, water condition, and nutrient condition, the other series was cultivated under shade that cut off incident light at 50% by a shade curtain. After 28 days, there were some distinct characteristics between the two. In the first series, Height of cucumber plants was higher, and color of leaf was greener.
Leaf reflectance measurement was carried out in a laboratory darkroom and a greenhouse chamber using the Geophysical Environment Research Field Portable Spectrometer (GER-2600). The GER-2600 records radiation in 650 channels over 350-2500 nm wavelength range. Leaf reflectance is a ratio of foliar radiance to white board's radiance. The reference radiance is defined as the radiance of a white-board made from BaSO4. Light source used in the darkroom case was the standard halide lamp, and in the greenhouse chamber case the sunlight is the incident light.
The fresh leaf's light-photosynthetic rate curve was measured by the portable photosynthesis system (LI-cor, LI-6400). This instrument can control all environmental variables, such as CO2, H2O concentration of both input flux and output flux, leaf surface temperature and an incident light. Also the LI-6400 is able to measure stomatal conductance and evapotranspiration. In this experiment, we measured net photosynthetic rate with photon flux density ranging from 0 to 2000 [mmol m-2 s-1].
3.2. Measurements of Chlorophyll and Nitrogen Concentration, Leaf Area, and Dry Mass of Leaf
The leaf area was determined prior to pigment analysis. Leaf area was determined as the result of the following steps. First step was to cut a fresh leaf, second step was to photocopy the fresh leaf by a copying machine, third step was to import monochrome image of leaf into PC, final step was to measure leaf area using the software-NIH Image, version. 1.62, distributed by National Institute of Health, USA. After photocopying, the cut leaf was dried for 48hrs in the drying machine at 80°C, and then the weight of the dried leaf was weighed.
The chlorophylls were extracted in 100 % DMS (N,N'-dimethylformamide) with a leaf disc of 1.0 cm diameter. Extractable efficiency of DMS is stronger than that of acetone4.. The absorption of the extract at 663.8 nm and 646.8 nm were measured with a HITACHI, U-1000 spectrophotometer. Chlorophyll a, chlorophyll b and chlorophyll a+b concentration (mg /ml) are calculated by Eq. (2):
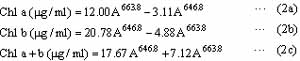
where A663.8 and A646.8 are the absorbance at 663.8 nm and 646.8 nm wavelength, respectively.
The nitrogen concentration was determined using the NC-90A (Sumika Chemical Analysis Center), that can detect total nitrogen and carbon content in the sample. The calibration curve was obtained with the analytical standard acetanilide as a standard reagent. Total nitrogen content was determined as Eq. (3):

where area is the measured peak area of total nitrogen.
4. Results and Discussion
4.1. Correlation Between Biochemical Content and Model's Parameters
Correlation between the measured saturated Amax and chlorophyll a concentration per unit area was high with a coefficient of determination of R2=0.91. There was linear correlation between saturated Amax and chlorophyll a concentration per unit area, as saturated Amax value increased in proportion to chlorophyll a concentration. But chlorophyll a concentration per unit mass didn't correlate with saturated Amax. Furthermore, both chlorophyll b concentration per unit area and its per unit mass didn't correlate with saturated Amax. R didn't correlated for chlorophyll a concentration per unit area or chlorophyll a concentration per unit mass. However, R had the best correlation with saturated Amax. Also total nitrogen concentration per unit area very much correlate with saturated Amax, R2=0.91. But total nitrogen concentration per unit mass didn't correlate with saturated Amax. Figure 1 shows correlation between saturated Amax and chlorophylls per unit area (left diagram) and between saturated Amax and total nitrogen concentration per unit area (right diagram).
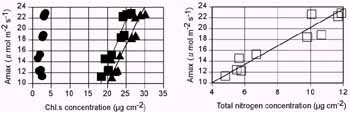
Figure 1. Correlation between saturated Amax and chlorophylls concentration per unit area (left) and total nitrogen concentration per unit area (right); g stands for chlorophyll a, = stands for chlorophyll b, 5stands for chlorophyll a+b, 1 stands for total nitrogen
4.2. Relationship between biochemical concentration and leaf reflectance
Figure 2 shows result of spectral reflectance curves of cucumber leaves in greenhouse chamber. The curves had common characteristics. There was the first positive peak called as the green peak driven by chlorophylls and carotenoids at 550 nm. There was a negative peak identified by absorption band of chlorophyll a at 680 nm. Moreover, these curve had red edge region and plateau region depending on its leaf structure over 700 nm. This reflectance curve is a typical reflectance curve of leaf.
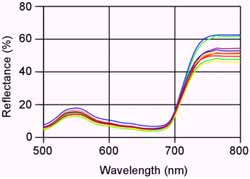
Figure 2. A reflectance of cucumber's leaves in the greenhouse chamber
Three methods were examined to estimate chlorophyll a concentration per unit area from spectral reflectance; (1) a correlation between chlorophyll a concentration per unit area and spectral reflectance at one single wavelength; (2) a correlation between chlorophyll a concentration per unit area and ratio of spectral reflectance at two different wavelengths; (3) a correlation between chlorophyll a concentration per unit area and the first derivative spectral reflectance at one single wavelength.
A range of wavelength was selected between 500 nm to 800 nm to remove the effect of water and sensor noise. As the result from these methods, coefficient of determination of the method using spectral reflectance at one single wavelength was low over all ranges of wavelength in the greenhouse chamber. This result is shown in Figure 3 (left). Distribution of coefficient of determination between chlorophyll a concentration per unit area and the ratio of spectral reflectance at two different wavelengths is shown in Figure 3 (right). The ratio became higher than that of spectral reflectance at one single wavelength. Also the ratio became high, when either denominator or numerator was selected as spectral reflectance at absorption band of chlorophyll a. The coefficient of determination between the first derivative spectral reflectance and chlorophyll a concentration per unit area is shown in Figure 4. There were three peaks. The first peak was due to pigments like chlorophylls and carotenoids. The second peak was absorption band of chlorophyll a. The third peak is due to the structure of leaf.
The authors found that two methods were effective to estimate chlorophyll a concentration per unit area using hyperspectral data. Moreover, it is important to select the best method based on the measurement condition. In case of the experiment in the greenhouse chamber, the best method was the first derivative spectral reflectance.
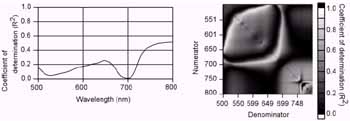
Figure 3. Coefficient of the determination between chlorophyll a concentration per unit area and spectral reflectance at one single wavelength in the greenhouse chamber (left) and distribution of coefficient of determination between chlorophyll a concentration per unit area and ratio of spectral reflectance at two different wavelengths (right) in the greenhouse chamber
Figure 4. Coefficient of determination between the first derivative spectral reflectance and chlorophyll a concentration per unit area
4.3. Evaluation of Net Photosynthetic Rate
In this study, the first derivative spectral reflectance was considered best to estimate chlorophyll a concentration per unit area. This process model was obtained based on both relationship between saturated Amax and chlorophyll a concentration and between chlorophyll a concentration and the first derivative spectral reflectance. Model's parameters were estimated as shown in Eq. (7).
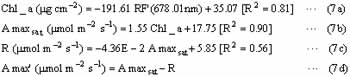
Chlorophyll a concentration per unit area could be estimated with R2=0.81 using the first derivative spectral reflectance at 678.01 nm and then saturated Amax could be estimated with R2=0.90 by the estimated chlorophyll a concentration. Also R can be estimated by saturated Amax, and finally, Amax' was calculated by saturated Amax and R. The Light-photosynthetic rate curve was drawn. We estimated net photosynthetic rate at PFD condition that is same as that in greenhouse chamber. The relationship between measured net photosynthetic rate and estimated net photosynthetic rate is shown in Figure 7. Coefficient of determination was 0.74.
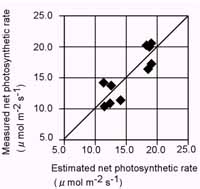
Figure 7. Correlation between measured net photosynthetic rate and estimated net photosynthetic rate
6. Conclusion
It is important to estimate parameters of a terrestrial ecosystem function to solve the global environmental issues. Hyperspectral remote sensing is a new technology, which is most useful to estimate biochemical parameters. This study investigated whether it is possible to estimate net photosynthetic rate from hyperspectral remote sensing. It was found that the net photosynthetic rate could be estimated by chlorophyll a concentration per unit area with hyperspectral data. Also, the net photosynthetic rate could be estimated by nitrogen concentration per unit area a similar equation that is a little bit different in respect of selected wavelength at 732.122 nm. The saturated Amax could be estimated with chlorophyll a or nitrogen concentration per unit area measured by hyperspectral data. Further, the saturated Amax could be used to estimate the respiration. Then our process model could estimate net photosynthetic rate with coefficient of determination of 0.74. We've suggested a new method to estimate CO2 uptake based on the estimated chlorophyll or nitrogen concentration per unit area.
In future, it will be necessary to examine relationship between physiological variables and model's parameters to net photosynthetic rate at canopy and community scale. Furthermore Blackman type will be modified to accommodate in consider effects of temperature and water stress and so on. Then biochemical variables of a terrestrial ecosystem like lignin and cellulose will be estimate using hyperspectral imager at canopy and community scale.
Acknowledgments
This work was supported by two divisions of NIES - the natural vegetation conservation research team of the global environment division; the information processing and analysis section of the social and environmental system division.
References
- Lee F. Johnson, Christine A. Hlacka, and David L. Peterson, "Multivariate Analysis of AVIRIS Data for Canopy Biochemical Estimation along the Oregon Transect ", REMOTE SEN. ENVIRON., 47, pp. 216-230. 1994.
- Paul J. Curran, John A. Kupiec, and Geoffrey M. Smith, "Remote Sensing the Biochemical Composition of a Slash Pine Canopy", IEEE TRANSSACTION ON GEOSCIENCE AND REMOTE SENSING, 35, NO. 2, MARCH, pp. 415-420. 1997.
- Blackman FF, "Optima and limiting factors", Annals of Botany, 19, pp. 281-295. 1905.
- R. J. Porra, W. A. Thompson and P. E. Kriedeman, "Determination of accurate extinction coefficients and simultaneous equations for assaying chlorophylls a and b extracted with four different solvents: verification of the concentration of chlorophyll standards by atomic absorption spectroscopy ", Biochi. mica et Biophysica Acta, 975, pp. 384-394. 1989.