| GISdevelopment.net ---> AARS ---> ACRS 2000 ---> Hyperspectral & Data Acquisition Systems |
Hyperspectral Image
Compression Using Three-Dimensional Wavelet Transformation
Yi-Hsing TSENG, Hung-Kuan
SHIH, Pai-Hui HSU
Department of Surveying Engineering
National Cheng Kung University, Tainan,
Taiwan, R.O.C.
E-mail: tseng@mail.ncku.edu.tw
Keywords: Hyperspectral Image, Image
Compression, 3-D Wavelet Transformation,
ClassificationDepartment of Surveying Engineering
National Cheng Kung University, Tainan,
Taiwan, R.O.C.
E-mail: tseng@mail.ncku.edu.tw
Abstract
A three-dimensional (3-D) wavelet compression method for hyperspectral images is proposed. This method applies a separable 3-D wavelet transformation (WT) to hyperspectral datacubes resulting in wavelet coefficients for 3-D multi-resolution image representation. The coefficients are then compressed using the optimal scalar quantization. Finally, Huffman coding is applied to save storage space. Experimenting on an AVIRIS image is performed with various combinations of wavelet banks, transformation levels, and quantization intervals. The decompressed images are evaluated objectively and subjectively, based on signal-to-noise ratio (SNR) and classification accuracy measures, respectively. The results show that a two-level 3-D WT offers a compressed ratio (CR) in between 20 and 150, which would be suitable for most applications. A comparison of two wavelets shows that the db3 wavelet outperforms the db1 wavelet based on both objective and subjective evaluations. The results also show an interesting phenomenon in which classification accuracy does not drop in response to an increase in information loss. Information loss caused by image compression possesses two different effects: image roughing due to quantization and smoothing due to decomposition. In this data set, image smoothing promotes classification accuracy, while image roughing reduces classification accuracy.
1. Introduction
Hyperspectral images provide much richer and finer spectral information than traditional multispectral images, however the volume of generated data is dramatically increased. Image compression will be essential for economical of distribution when spaceborne hyperspectral data are regularly available. Image compression reduces storage requirements, network traffic, and therefore improves efficiency. However, the satisfactory image compression requires a large compression ratio and a small amount of information loss. A lossless compression is the best choice as long as the compression ratio is acceptable, but it usually cannot offer a satisfactory compression ratio due to the limitation of image entropy. Typical hyperspectral data, such as images obtained with the Airborne Visible/Infrared Imaging Spectrometer (AVIRIS), are stored as 16-bit words, and have an average entropy of about 9 bits/pixel (Ryan and Arnold, 1997). Therefore, in most cases, lossless hyperspectral image compression hardly achieves a compression ratio greater than 2. To obtain significant image compression, lossy compression is preferable to a lossless compression. Under these circumstances, preserving the most useful information when compressing an image to an acceptable size becomes the central issue of hyperspectral image compression (Qian et al., 2000).
Hyperspectral data sets are referred to as datacubes because of their 3-dimensional (3-D) nature (two spatial dimensions and one spectral dimension). Conventional image compression techniques explore useful information within the two spatial dimensions. Among these techniques, wavelet transformation (WT) has been proven to be very efficient for 2-D image coding (Antonini et al., 1992). Compared to the popular method, discrete cosine transform (DCT), WT extracts not only frequency information, but also spatial information. For multispectral image compression, band images are usually compressed separately with a 2-D image coding technique, so that spectral redundancy will not be explored. A hybrid scheme was proposed to solve this problem using a two-step transformation (Markas and Reif, 1993). First, a spectral transformation, such as principal component transformation (PCT) or DCT, is applied to decorrelate spectral information. Second, 2-D image compression is applied to each transformed component. Removing spectral redundancy is achieved by compressing the subordinate components more than the dominant components. Although the hybrid scheme, in a sense, may be one of the most suitable methods for hyperspectral image compression, it does not fully take the advantage of the 3-D nature of hyperspectral data. A 3-D WT is therefore proposed to simultaneously explore the most representative information in the spatial and spectral dimensions. Figure 1 shows a block diagram of this 3-D wavelet compression method.
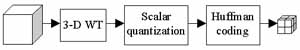
Fig 1. 3-D wavelet compression process.
2. 3-D Wavelet Transformation
A wavelet transform (WT) decomposes a signal into a series of smooth signals and the associated detailed signals at different resolution levels (Mallat, 1989). At each level, the smooth signal and associated detailed signal have all of the information necessary to reconstruct the smooth signal at the next higher resolution level. The transformed signal has both time and frequency information from the original signal and provides a good representation for coding. The WT application to image compression has shown promising results (Antonini et al., 1992).
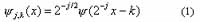
A multiresolution WT involves two functions: a mother wavelet y and a scaling function f . Let the normalized scale factor be 2j and the translation be k×2j (where j, kÎ Z), then the dilated and translated wavelets will be:
Also, the dilated and translated scale functions will be:
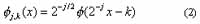
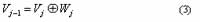
For fixed j, the fj,k are orthonormal. The spaces Vj spanned by the fj,k describe successive approximation spaces,¼V2Ì V1Ì V0Ì V-1Ì V-2 ¼, each with resolution 2j. For each j, the yj,k span a detail space Wj which is exactly the orthogonal complement in Vj-1 of Vj:
It has been proven that any scaling function is specified by a discrete filter called a conjugate mirror filter. The causality Vj+1 Ì Vj is verified using a conjugate mirror filter:

Similarity, the causality Wj+1 Ì Vj is verified by:

The scaling coefficients áf, fj,kñ, denoted by ajk, characterize the projection of f onto Vj. The detailed coefficients áf,yj,kñ, denoted by djk, describe the information lost when going from an approximation of f with resolution 2j-1 to the coarser resolution 2j. If f(x)ÎL2(R), it can be decomposed into a series of smooth signals and the associated detailed signals at different resolution levels:
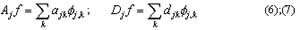
Based on (4) and (5), one obtains

Substituting (8) and (9) into (6) and (7) respectively:

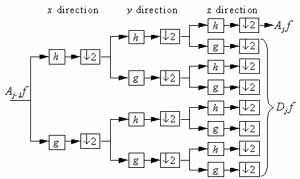
The multiresolution WT can be implemented using a two-channel perfect reconstruction filter bank as shown in (10) and (11). The first channel is a low-pass filter h and the second channel is a high-pass filter g. The WT of a signal can be obtained by repeatedly applying the two-channel filter bank to the signal in a pyramidal scheme. A separable 3-D WT can be computed by extending the pyramidal algorithm. Suppose the spatial dimensions are labeled x and y, and z denotes the spectral dimension. The decomposition can be performed sequentially; by first convoluting the x-direction, followed by the y and z directions. Figure 2 shows a one-level 3-D WT.
Figure 3 shows the eight data blocks resulting from a one-level image cube 3-D WT. Three-letter labels are marked on each data block to denote the filter type in the x, y, and z directions. L denotes a low-pass filter and H denotes a high-pass filter. The block in the top-left corner is the low-frequency portion of the image cube. The other blocks are filtered at least once with a high-pass filter and therefore contain high-frequency components in one of the directions. The low-frequency block can be further decomposed into eight more blocks. The WT yields a good representation of the original image for compression purposes. The low-frequency component of WT contains about 90% of the total energy in most cases. Different blocks and different levels of resolution can be coded in different ways to improve compression results.
 |
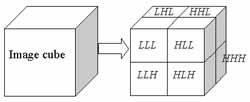 |
| Fig. 2. One level of 3-D decomposition. | Fig. 3. The eight data blocks resulting from the first level image cube 3-D WT. |
3. Optimal Scalar Quantization
The purpose of quantization is to reduce data entropy by decreasing the data precision. A quantization scheme maps a large number of input values into a smaller set of output values. This implies that some information is lost during the quantization process. The original data cannot be recovered exactly after quantization. A quantization strategy design must balance the compression achievement and information loss. One of the criteria for optimal quantization is minimizing the mean square error (MSE) given a quantization scale. The quantization scale is not necessarily uniform, and for most data sets the optimal quantization scale is not uniform. In this study, wavelet coefficients were compressed using the optimal scalar quantization scheme proposed by (Lloyd, 1957) and (Max, 1960), which is commonly called the Lloyd-Max quantization.
The data blocks resulting from the 3-D WT are represented by floating point values and consist of two types of data: the LLL block, which preserves most of the energy; and the other high-resolution data blocks, which contain the sharp edge information. Figure 4 shows the histograms of a typical LLL data block and a typical high-resolution data block. The LLL block obviously has a much larger data range than the high-resolution data blocks. It is therefore reasonable to apply a large quantization scale for the LLL block and a relatively small scale for the other blocks. In this study, we used 256 intervals for the LLL block and less than 32 intervals for the other blocks.
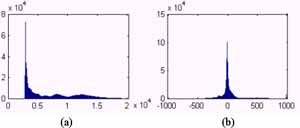
Fig. 4. The histograms of (a) a typical LLL data block and (b) a typical high-resolution data block.
4. Huffman Coding
The final step in the compression process is coding. Huffman coding (Huffman, 1952) is a minimum redundancy coding. It assigns fewer bits to the values with a higher frequency of occurrence and more bits to the values with a lesser frequency of occurrence. Based on the occurrence frequency of each quantization level, a hierarchical binary coding tree structure brings by sequentially finding the lowest two frequencies as tree branches and adding each low frequency pair as a new node for the next level. Huffman coding allows reforming the data to be optimized in less space than the original data.
Because each data block is quantized into different numbers of quantization levels, the coding process should be performed for each data block separately. Compared with equal-length coding, Huffman coding can easily save more than 50% of the required memory space without losing any information.
5. Test Data and Evaluation
5.1 Test Data
The test data is an AVIRIS image downloaded from the web site (http://dynamo.ecn.purdue.edu/~biehl/MultiSpec/) of Purdue University. The image size is 145 145 pixels with 220 bands, and the pixels are stored as 16-bit words. The storage size is about 9.3 mega-bytes. Figure 5 shows a perspective picture of the image cube. The image was taken in 1992, covering the Indian Pine Site 3, an agriculture area. The ground truth is also available for image classification evaluation. There are 16 land cover classes, in which some classes may be grouped into single landuse types. For example, corn, corn-min, and corn-notill belong to the corn landuse type, but due to the differences of crop canopies they are categorized into three different land-cover classes. Classes of a same group tend to possess similar spectral properties, so that it is usually difficult to differentiate them in a multispectral image. This data set was especially provided to show the application potentials of hyperspectral images.
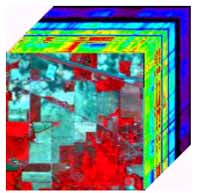
Fig. 5. A perspective picture of image cube of the test data.
5.2 Evaluations of Image Compression
There are two ways to evaluate the quality of decompressed images: the objective and subjective evaluations. The objective method measures the amount of information loss or preserved by comparing decompressed images with the original one. The amount of information loss may be defined as mean square error (MSE), or the amount of preserved information can be described as cross correlation (CC) or signal to noise ratio (SNR) etc. Although MSE and CC objectively gauge the image difference, they are sensitive to strong signals. For most images with textures, SNR is an ideal assessment of how much the original signal preserved after a compressed image is recovered from compression, and is commonly applied for the evaluation of image compression. Therefore, in this paper, SNR is used as an objective measure to evaluate the performance of the developed algorithm.
The subjective evaluation is a measure of the performance of decompressed images on certain applications, for example visualization, feature extraction, or classification etc. Because image classification is a common application of a remotely sensed image, the classification results of the original and decompressed images are therefore compared to obtain subjective measures. Supervised classification using maximum-likelihood classifier is applied for the classification test. All samples of the ground truth data are used as training data, and they are also used as reference data for accuracy assessment. Theoretically, all spectral bands of image should be involved in the classification process. However, due to the insufficiency of training samples, classification will be failed if all spectral bands are used. In order to reduce the number of feature space dimension, only the first 30 principal components of image are extracted and used for classification. When the original image is applied, the resulted overall accuracy of classification is 89.39%.
6. Experimental Results
Two selected wavelet filter candidates were employed for the 3-D WT. They are the Daubechies_1 (db1) (i.e. the Hard) and Daubechies_3 (db3) (Daubechies and Micchelli, 1994). Because the Daubechies scaling function f and wavelet y have the supports [0, 2p-1] and [-p+1, p] (p denotes the vanishing moments), the db1 filters have the supports [0,1] and [0,1] and the db3 filters have the supports [0,5] and [-2,3]. The Lipschitz regularity of the db1 wavelet y is about 0.3 and the db3 wavelet y is Lipschitz 1.08. This means that the db3 wavelet y is continuously differentiable, whereas the db1 wavelet y is not. The choice of an optimal wavelet is a trade-off between the number of vanishing moments and its support size (Mallat and Hwang, 1992). A high amplitude wavelet coefficient occurs when the wavelet has a support that overlaps a brutal transition like an edge, which should thus be as small as possible to reduce the quantization error. In addition, over smooth regions, the wavelet coefficients are small at fine scales if y has enough vanishing moments to take advantage of the large Lipschitz regularity. However, the support size of y increases proportionally to the number of vanishing moments. For large classes of natural images, it has been observed numerically that the distortion rate is optimized with wavelets having three or four vanishing moments. Therefore, to obtain optimal results, the db3 wavelet was adopted. The db1 wavelet was applied for comparison because of its computation simplicity.
A four-level 3-D wavelet decomposition was applied to the test image with the db1 and db3 wavelets respectively. For each decomposition level, we used 256 quantization intervals for the LLL block and tried 0, 4, 8, 16, and 32 intervals for the other blocks, in which 0 interval means that the data block is ignored. With various combinations of using different decomposition levels and quantization intervals, objective measures (SNR) and subjective measures (classification overall accuracy, OA) are presented versus compression ratio (CR).
In order not to make complicated combinations, only data blocks from the highest decomposition level were kept, i.e. data blocks from the lower decomposition levels were always ignored. Therefore, for CR less than 20, a one-level decomposition was applied with the five-quantization intervals on high-resolution blocks to obtain five combinations of compression, which is denoted as the level 1 result. To take a two-level decomposition, high-resolution blocks in the first level were discarded and same five combinations were made for data blocks in the second level to obtain the results from level 2. The results from level 3 and 4 were obtained after the fashion of the previous combinations. Figure 6 shows compression ratios achieved with respect to different combinations, which reveals a clue to determining an appropriate decomposition level. The first decomposition offers a CR less than 20. It cannot produce a CR greater than 10 if one does not discard the high-resolution data. Generally speaking, for most applications, the appropriate CR range should be between 10 and 100. It is not necessary to compress an image by a factor of more than 100. The second decomposition offers a CR in between 20 and 150. Therefore, the level-2 combinations are good choices for hyperspectral image compression. Figure 6 also shows the fact that the db1 wavelet offers a higher CR than the db3 wavelet under the same decomposition and quantization combinations. This fact, however, is not the key factor for judging compression performance.
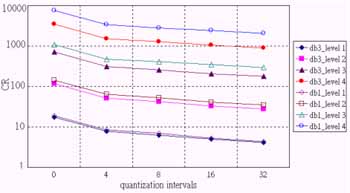
Fig. 6. Compression ratio versus different combinations of filters, decomposition levels, and quantization intervals.
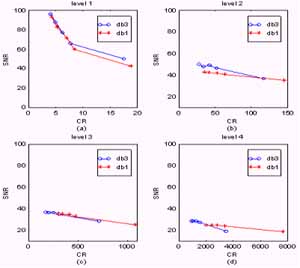
Figure 7 (a), (b), (c), and (d) show the objective measures of the 1, 2, 3, and 4 level results, respectively. Comparing the db1 and db3 wavelet performance, two concluding remarks can be made. First, the db3 wavelet outperforms the db1 wavelet at a given CR based on the objective evaluation. Second, the SNR drops rapidly in the first decomposition level, but after that, the decrease becomes lesser with respect to the rapid increase in CR. Concerned with practical applications, the first conclusion implies that the db3 wavelet is a better choice than the db1 wavelet. Figure 8 (a), (b), (c), and (d) show the subjective measures of the level 1, 2, 3, and 4 results respectively. Based on a subjective evaluation, the db3 wavelet also obviously outperforms the db1 wavelet. In the level-4 combinations, decompressed images were even not converged in the classification process.
 |
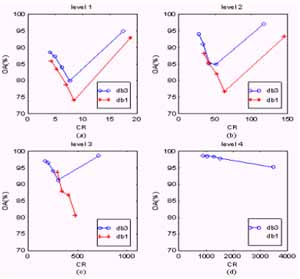 |
| Fig. 7. The SNR measures of the 4 different level combinations versus compression ratio. (a) level 1. (b) level 2. (c) level 3. (d) level 4. | Fig. 8. The classification accuracy measures of the 4 different level combinations versus compression ratio. (a) level 1. (b) level 2. (c) level 3. (d) level 4. |
An interesting phenomenon can be observed in Figure 8. OA Values do not decrease in response to the increase in information loss. In each decomposition level, the OA reduces when the number of quantization intervals drops, but it suddenly goes up to a level even higher than the original data when the number of quantization intervals goes to zero (i.e. ignoring all high-resolution data). This phenomenon still has us puzzled. A reasonable explanation is that information loss caused by image compression possesses two different effects: image roughing and smoothing. When the number of quantization intervals drops, the image is roughed. However, if all of the high-resolution data are ignored, the image is smoothed by wavelet decomposition. Hsieh (Hsieh, 1998) demonstrated that spatially smoothing a hyperspectral image improves the classification accuracy. The phenomenon can be explained in response to Hsieh's conclusion. The OA went up to 99% when a four-level decomposition was applied. The reason it reached a higher accuracy than Hsieh's demonstration was due to the 3-D smoothness. However, one should take a conservative view of this conclusion, because the spatial reference data distribution strongly affects classification accuracy. Land-cover classes of ground truth in the test data set are distributed as blocks, and so are Hsieh's data sets. Under this circumstance, the fact that smoothing images increases the classification accuracy (and vice versa) can be expected. However, this will not be true if the class data are not distributed as blocks.
7. Conclusion
An efficient scheme for hyperspectral image compression using 3-D wavelet transformation (WT) was developed. This scheme simultaneously explores useful information in the spatial and spectral dimensions and fully takes advantage of the 3-D nature of hyperspectral data. The 3-D WT yields a good representation of an image cube for compression purposes. The low-frequency WT component contains about 90% of the total energy in most cases. Various blocks and resolution levels can be coded in various ways to improve compression results. Using two-level wavelet decomposition offers compression ratios between 20 and 150 that are appropriate for most applications.
Both objective and subjective evaluations confirm that the db3 wavelet outperforms the db1 wavelet at a given CR. This implies that the db3 wavelet is a better choice than the db1 wavelet for the proposed scheme.
The subjective measure does not decrease in response to an increase in information loss. Information loss caused by image compression possesses two different effects: image roughing and smoothing. Smoothing the image promotes classification accuracy, while roughing the image reduce classification accuracy. Generally speaking, 3-D image compression is a sort of 3-D hyperspectral data feature extraction. However, how 3-D features contribute to classification requires further investigation.
Acknowledgement
We thank the National Science Council, ROC, for the support of this research project: NSC89-2211-E006-084.
Refferences
- Antonini, M., Barlaud, M., Mathieu, P. and Daubechies, I., 1992. Image Coding Using Wavelet Transform. IEEE Transactions on Image Processing, 1(2):pp. 205-220.
- Daubechies, I. and Micchelli, C.A., 1994. Ten Lectures on Wavelets.SIAM.
- Hsieh, P.F., 1998. Classification of High Dimensional Data. Ph.D. Thesis, Purdue University.
- Huffman, D.A., 1952. A Method for the Construction of Minimum Redundancy Codes. Pro. IRE, 40:pp. 1098-1101.
- Lloyd, S.P., 1957. Least Squares Quantization in PCM. IEEE Trans. Info. Theory, IT-28:pp. 129-137.
- Mallat, S. and Hwang, W.L., 1992. Singularity Detection and Processing with Wavelets. IEEE Transactions on Information Theory, 38(2):pp. 617-643.
- Mallat, S.G., 1989. A Theory for Multiresolution Signal Decomposition : The Wavelet Representation. IEEE Transactions on Pattern Analysis and Machine Intelligence, 11(7):pp. 674-693.
- Markas, T. and Reif, J., 1993. Multispectral Image Compression Algorithms. Data Compression Conference, DCC '93.,:pp. 391-400.
- Max, J., 1960. Quantizing for Minimum Distortion. IRE Trans. Info. Theory, IT-6(1):pp. 7-12.
- Qian, S.E., Hollinger, A.B., Williams, D. and Manak, D., 2000. Vector Quantization Using Spectral Index-Based Multiple Subcodebooks for Hyperspectral Data Compression. IEEE Transactions on Geoscience and Remote Sensing, 38(3):pp. 1183-1190.
- Ryan, M.J. and Arnold, J.F., 1997. The Lossless Compression of AVIRIS Images by Vector Quantization. IEEE Transactions on Geoscience and Remote Sensing, 35(3):pp. 546 -550.