| GISdevelopment.net ---> AARS ---> ACRS 2000 ---> Global Change |
Relationship between canopy
brdf and physical parameters Of 3-d structure of vegetaion in northern
wetlands in japan
Michiru MIYAMOTO*, Kunihiko
YOSHINO**, Keiji KUSHIDA***(JAPAN)
* Ms., Graduate School of Agricultural and Life Sciences, Biological Environmental Engineering, University of Tokyo
1-1-1 Yayoi, Bunkyo-Ku, Tokyo, 113-8657
Tel: +81-3-5841-5370 Fax: +81-3-5841-8169
E-mail:aa07102@mail.ecc.u-tokyo.ac.jp,michiru521@hotmail.com
** Assistant Prof., Institute of Policy and Planning Science, Tsukuba University
1-1-1 Tennou-dai, Tsukuba, Ibaraki, 305-8573
Tel: +81-298-53-5005 Fax: +81-298-55-3849
E-mail:sky@shako.sk.tsukuba.ac.jp
*** Assistant teacher., Institute of Low Temp. Sci. Hokkaido University
Sapporo, 060-0819
Tel: +81-011-706-5490 Fax: +81-011-706-7142
E-mail:kkushida@pop.sk.lowtem.hokudai.ac.jp
Key Words: Wetland Vegetation, Productive 3-D Structure, Multi Angles, Spectral Reflectance, Vegetation Indices
Abstruct:
The canopy spectral reflectance at multi angles and the 3-D structures of vegetation were measured in "Kushiro wetland" and " Akkeshiko - Bekanberushi Wetland" located in the eastern part of Hokkaido; the north island of Japan in the summer of 1998. Our purpose of this research was to clarify the characteristics of spectral reflectance and to develop the algorithm according to the wave bands and the band ratio with multi angles effective to the classification and the estimation biomass used cross - near range R.S. We clarified the relationship of the spectral reflectance and each 3-D biomass layer structure specific to the wetland vegetation. The bi-band ratio of reflectance and the LAD ( Leaf Area Density) - SLA (Specific Leaf Area) and the productive structure by the stratified clip method was measured. And we specified the canopy layer structure by the observation at not only the nadir angle but also the plural angles from±15°to ±45°range.
The values with remarkable difference could be seen at multi angle rather than nadir, and also infrared rather than red range, especially among the similar vegetation canopies located in the transition moor. While we could not find out any effectively different values for the classification among the fens and the transition moors in G/NIR, R/NIR, and NDVI, though the effectiveness of those could be seen in only bog Muskege and the fen and the transition - moor mixed with shrub. On the other hand, G/R and VI were effective to them classify. The spectral reflectance of the canopies depended on their canopy 3-D structures and their dominant vegetation types. Selecting the specific wave bands and their band ratio observed at multi - plural angle with cross - near range R.S. data was effective for the estimation of the biomass and the classification of wetland vegetation.
1. Introduction
The estimation of CH4 flux at each wetland vegetation in global wide range is in urgent necessity for the study of the influence of the global warming. From the local point of view, it is necessary to grasp the vegetation distributions in wide range to understand the extension of the migration belt and the biodiversity to preserve the wetland vegetation.
So many researchers are trying to classify vegetation in wetlands using satellite or aeroplane .S. in order to make vegetation maps. Recently, the spectral reflectance of vegetation canopy measured at multi angles has a lot of information of canopy structure as well as species types. However the precision of classification of wetland vegetation based on R.S. is not enough for the reason why the wetland vegetation has the complicated layer structure and its specific characteristics especially situated in bog and transition mixed vegetation. Our goal of this research is to develop the algorithms and make it clear the relationship of the characteristics of the spectral reflectance measured at plural angles and the 3 - D layer biomass structure.
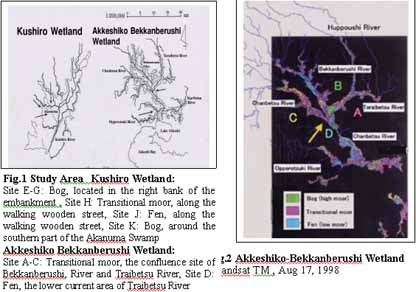
2. Study Area
The research was carried out at typical fen, transitional, bog vegetation in Akkeshiko Bekkanberushi wetland, and Akanuma in Kushiro wetland, eastern part in Hokkaido( Fig.1 ). The former is the second largest and the latter is the largest wetland in Japan and they have been registered in the list of wetlands of international importance. Especially, the bog in Akkeshiko Bekkanberushi wetland is known as the academically precious existence with little artificial impact. The concrete investigation site was peat bog in which the Sphagnum moss piled up located in the confluence point of Toraibetsu River and Bekkanberushi River and where precious alpine plant develops ( site A - C ) and the fen besides Taibetsu River ( site D ) ( Fig.2 ). In Kushiro at the bog right bank of Kushiro River ( site E - G ), the fen along the walk street inside the wetland ( site H, I ) and the transitional moor paralleled old railway ( site J ). This research was carried out in June and July, 1998.
2. 2 Measurement of Vegetation Research and Biomass
The vegetation research and the biomass were measured. Since the layer structure is complicated, the productive structure figure were made with the combination of dominant species and other species. Each 0.5m×0.5m quadrat was set based on the simple random sampling method. We measured occurrence, dominance, sociability, vegetation cover, and height above the ground for herbaceous layer, moss layer, bush layer. Each vegetation photos in the quadrate were taken above two m high from the canopy by using long pole carried with two steel cameras and optical tube sensor on the top. Based on the stratified clip technique, the biomass measurement was carried by cutting down from the top of the plant community in every 10cm interval. The dry mass were measured ( 48 hours at 80 degrees ) after they were diffrenciated in photosynthesis organ ( assimilatory organ ; lamina ) and non-photosynthesis organ ( non- assimilatory organ ; stem, spike, petiole, flower ) on each 10 cm layer and the species. Leaf Area Index {LAI: all leaf area ( cm2) / 0.5m×0.5m quadrat} and Leaf Area Density ( LAD: all leaf area ( cm2) / 0.5m×0.5m quadrat / 10 cm layer ) were also measured. And we examined the relationship between LAD - SLA in each layer to specify the two dimension data of each biomass and leaf area.
- In order to grasp features of the spatial distribution of classification and stratification of the biomass, LAD was concerned.
- So as to understand the layer unit of biomass characteristics, Specific Leaf Area { SLA: dry weight (g) / leaf area (cm) / 10cm layer } was measured.
The spectral reflectance energy intensity from the vegetation was measured with zenith, ±15°,±30°, ±45°angle on both chief plane and perpendicular plane. Three repetitions were taken for the measurement ( Fig 3 ) The bidirectional spectral reflectance two meter above the canopy were measurement by using VIS - IR portable spectrometer, SD - 1000 made by Ocean Optics Co. Ltd ( Table.1 ) set on the long pole. Each 1m×1m quadrat was set for the measurement. As to the reflectance of the reference, they were calculated from the ratio with energy intensity of reflectance on the object using standard albedo board. Before the spectral measurement, the solar altitude, solar azimuth, time, background value from the sensor energy were researched. Actually in the field, since the sub sensor receive the solar incident energy several times as much as that of the master sensor. Therefore, we reduced the amount of the incident energy from the sun by either shortening integral time or setting the filter of cutting specific wave bands and we narrowed the slit to avoid the saturation.
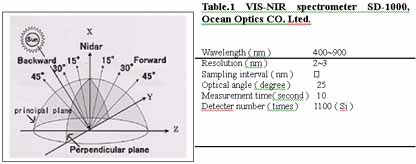
Fig. 3 BRDF measurement The spectral reflectance energy intensity from the vegetation was measured with zenith, ±15°,±30°, ±45°angle on both chief plane ( X-Z coodinate axis ) and perpendicular plane ( X-Y coodinate axis ).
The ideal value from the measurement wavelength range was limited in 400 - 900nm because of the accuracy of the spectrometer SD - 1000. In this study, the diffuser board, with obscured glass on the standard albedo board was used. It enabled us to remove the effect of the dependence of the angular noise. The vegetation index ( NDVI: normalized difference vegetation, VI: simple vegetation index ) and each band ratio ( G / NIR: green / near infrared, R / NIR: red / near infrared, R / G: red / green ) were calculated from the spectral signature obtained from single band, green ( 530 - 550nm), red ( 650 - 670nm ), near infrared ( 760 - 810nm ) respectively at each site. We examined the relationship between LAI and the spectral signature with multi angle observation and detected the specific observation angle which is sensitive to the significant classification for each vegetation.
3. Resuls
3.1 vegetation research
The 46 species was identified according to the vegetation research. They are 16, 9, 21 in the low, transitional, high moor respectively. We could classify the 6 types hierarchy through the A - H site. Two types of fen ( Phleum - Carex in the field stratum and Alunus - Chamaedaphune in the shrubby stratum ), three types of transitional moor ( Phleum - Carex, Thelypteris in the field stratum and Chamaedaphune in the shrubby stratum ) and three types of bog ( Carex in the field stratum, the alpine plants in the dwarf shrub stratum and Sphagnum in the lichen bog stratum)
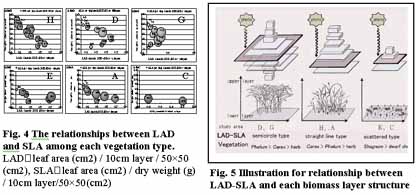
3.2 Productive Structure and Relationships between LAD and SLA
3.2.1 Productive Structure Diagram:
So far as the productive structure diagram is concerned, the similar tendency could be seen between D and G site dominated Carex and between A and H dominated Phleum. That is to say, the more lower layer the more biomass gradually tend to increase while Phleum type is rapidly tend to increase. The Sphagnum moss community in the site C, the biomass of the lower layer showed more large value.
3.2.2 LAD and SLA :
The area of leaf area in each 10cm layer unit was divided as dominant species and other species. The correlation and regression line among leaf area and height above the ground in each 10cm layer unit and dry weight was taken. Compared to the dominant species and other species, they showed converse tendency in dry weight and the leaf area each other. Namely, the monocotyledon type showed that the more lower layer the more dry weight increase though the Phleum dominated type and other broad leaved herb type decrease.
From the point of view of the LAD - SLA, there similar characteristics could be seen between site D and G ( Phleum and Carex dominated in the low-moor ), site H and A ( Carex dominated in the transitional moor along with the high moor ), site E and C ( Carex , shrub, and alpine plants dominated ), respectively. That is, we could classifier 3 types of the relationship between LAD and SLA which is represented semicircle type in the site D - G, straight line type in the site H - A type and dispersion type in the site C - E type ( Fig. 4 , 5 ).
3.3 Characteristics of Multi Angle Spectral Signature and Classification of Wetland Vegetation
The spectral reflectance was less than 15% in the visible range and 20 - 40% in the near infrared at the high moor vegetation. In the fen and transitional moor, less than 20 % in the visible range and 60 - 80% in the near infrared range. According to the angle observed from the nadir to ±45°?it clarified that the increase of the reflectance at visible range is more than 5% and that of the near infrared is about 20% in each vegetation type. That could be effective within the near infrared on the transitional vegetation.
3.3.1 Multi Angle Spectral Reflectance Measured at Single Bands:
At first the spectral reflectance in the Green band ( 530 -550nm ), the Red band ( 650 - 670nm ), and the NIR band ( 760 - 810nm ), were measured with multi angular. From the NIR and Green band point of view, we could not classifier the each spectral reflectance but could discriminate the difference by the measurement of the oblique forward 15°- 45°. Especially, it was very effective to discrimination of Sphagnum moss. In addition to that, it was also effective to the classification for the vegetation mixed with shrub. For concrete, when the shrub, Chamaedafune invaded to Carex vegetation, the reflectance of Carex vegetation became small. That is to say, we could extract the spectral reflectance of the vegetation mixed the shrub stratum, especially 10% in the Green band, 40% in the NIR band. The processing of the calculation of the band ratio for the spectral reflectance, NDVI and VI were effective to extract the typical three wetland vegetation type measured at ±15°rather than nadir angle. In addition to that, in Red/NIR, Green/NIR and NDVI, we could not find the effective differences except for the Sphagnum moss group, site C however effective to the vegetation mixed with Sphagnum and the shrub ( Fig.6 ).
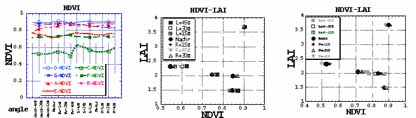
Fig.6 NDVI and its relationship with LAI measured at multi angles at each vegetation
3.3.2 Relationships between Band Ratio and LAI:
By selecting the effective and specific band ratio and vegetation indices with multi angles to discriminate each vegetation, it was possible to classifier the specific wetland vegetation by using the spectral data measured at 2m high above the canopy. It proved that even in the case that the difference of LAI was slight though the band ratio was actually quite different or the case that the difference of band ratio was similar though the LAI was quite different, the measurement at not only multi angles but also the nadir angle was very effective to the classification.
4. Discussion
4.1 Classification of Wetland Vegetation Concerning Canopy Productive Structure and Multi Angle Spectral Signature
It was obviously easy to extract such as Sphagnum from other vegetation without multi spectral measurement and was enough for only nadir angle. However, for the vegetation which had the similar kinds of canopy, such as both phleum and Carex were the first dominant species and the second dominant species were mixed with other herb species, multi angular measurement was evidently effective to discriminate from other similar kinds of vegetation. In addition to that, taking biomass into considerations, it is distinctly effective to compare and discriminate following type of vegetation. The vegetation with different spectral signature though the actual biomass was quite similar and the vegetation with quite different biomass though the actual reflectance was similar. It was verified that the multi spectral measurement was effective to the classification of the vegetation whose canopy has similar herb stratum. When we grasp wide range of wetland vegetation, we will be able to understand and estimate the spatial arrangement of the vegetation community by specifying the indefinite spectral signature in detail. As one of the basic technique of the remote sensing of vegetation, it appeals that it is important to clarify the physical relationship between the biological data including biomass and spectral signature with multi observation for verifying the effectiveness of remote sensing data. In the near future, it seems that the focus are making on the various spectral principles applied for the remote sensing data for the analysis of the research in order to clarify the spectral characteristics relating to the function of the ecosystem.
5. Conclusions
Following three statements are concluded in this study.
- Each productive structure was specified by the relationship between LAD- SLA in each layer.
- The characteristic of spectral signature measured at multi angle was clarified.
- By clarifying the relationship between the effective band ratio, it became clearly possible to classify the specific types of wetland vegetation especially herb stratum, mixed shrub stratum, and the only moss vegetation and by selecting specific vegetation index and observation angle, it became remarkably possible to estimate the biomass in each vegetation type in detail.
6. References
- Asrar, G., Kanemasu, E.T., Miller, G.P., and weiser, R.L., 1986. Light interception and leaf area estimates from measurements of grass canopy reflectance. IEEE Trans. Geosci.remote Sens.GE-24:76-82
- Christensen, S., and Goudriaan, J.,1993. Deriving Light Interception and Biomass from Spectral Reflectance Ratio, Remote Sens.Environ.43:87-95.
- Watson R. T., Zinyowera, C. Z., and Moss, R. H.,1996. 'Climate Change1995': Impacts, Adaptations and Mitigation of Climate Change: Scientific-Technical Analyses, Working Group?to the Second Assessment Report of the Intergovernmental Panel on Climate Change, Intergovernmental Panel on Climate Change, Cambridge University Press