| GISdevelopment.net ---> AARS ---> ACRS 2000 ---> Global Change |
An Operational Approach For
Mapping Bushfire History In The Tropical Savannas Of Northern Australia
Yue ZHANG1 Peter
WHITEHEAD2 Waqar AHMAD3 Carl Menges
4
1PhD Student, 2Director of KCTWM and A/Prof., 3Senior Lecturer, 4 Research Associate
Cooperative Research Centre for Sustainable Development of Tropical Savannas
1,2 Australian Research Council Key Centre for Tropical Wildlife Management
3,4 RS/GIS Lab, Faculty of Science, Information Technology & Education
Northern Territory University, Darwin, NT 0909, Australia
Telephone Number: +61 8 8946 6894 Facsimile Number: +61 8 8946 7088
E-mail:yue.zhang@ntu.edu.au
Key Words: interactive approach, DEM, bush fire mapping, savannas, Australia
Abstract
Tropical savannas occupy one third of Australia's landmass, and are composed of dense grasslands and scattered trees. Both deliberately lit and natural wildfire sweep across the vast monsoonal savannas of northern Australia each year and the consequence of these modern fire regimes can be catastrophic for fire-sensitive plants and animals. This paper presents an interactive methodology which improves the mapping accuracy for mapping fire history from Landsat Thematic Mapper data of an area with typical savanna landscape characteristics of northern Australia. A satellite image captured in the middle dry season of the year 2000 was used. With the visible red, NIR and MIR bands, an unsupervised digital image classification was carried out to delineate the burnt patches. These patches were labelled by using field knowledge as well as by on-screen assessment of the raw data and signature files for previously confirmed fire scars. Spectral overlap between fire scars, water bodies, shadows and miscellaneous geological features was observed and was eliminated by using of a binary spatial mask and the Digital Elevation Model (DEM). The validity of the fire mapping was assessed with the help of field data as well as using a high spatial resolution IKONOS image acquired at the time of the TM data recording.
1. Introduction
Wildfire has been considered as one of the major landscape characteristics in the Australian tropical savannas. Earlier studies have estimated that over 50% of the savannas in some regions of northern Australia are burnt during the 7-month (May-November) dry season each year (Press 1988). Even in Kakadu National Park, a United Nation's World Heritage property, an average of 55% of lowland savanna habitats and 28% of habitats occupying both sandstone plateau and riverine landforms has been burnt each year (Russell-Smith et al. 1997). Depending on a variety of purposes of management and conservation, dry season fire is ignited to reduce the level of flammable fuel loads, to encourage 'green pick' for cattle and kangaroos, and to create patchy mosaics of burnt and unburnt country to help developing habitat diversity (Jacklyn and Russell-Smith 1998). However, the bulk of late dry season uncontrolled wildfire sweeping across the Northern Territory of Australia, are catastrophic for fire-sensitive flora and fauna to be the consequence of such contemporary fire regimes. To add the understanding of the savanna landscape structure and dynamics, fire scars mapping has been carried out using satellite images (Russell-Smith et al. 1997).
Acquired in various geometric, radiometric and spectral resolutions, satellite remotely sensed data, multi-temporal or single post-fire, have been processed successfully to map burnt scars, species affected and post-fire recovery (Chuvieco and Congalton 1988, Pereira et al. 1997). Various fire-mapping methods have been developed and applied, but most of these focus on the areas where vegetation distribution and topographic features are comparatively uniform. However, when mapping bush fire in tropical savannas, such as in northern Australia, spectral overlaps between fire scars and terrain shadows, water bodies, unburnt canopies, and vegetation regrowth in burnt area create substantial difficulties in separating and discriminating fire classes. Russell-Smith et al. (1997) utilized the hard copies of Landsat MSS data to define the fire scars. In this study, an interactive fire mapping method that improves the accuracy of bush fire mapping and helps overcome these problems of separation and discrimination was developed for this special landscape type in the Australian tropical savanna.
2. Study area
The study area is located on the tropical savannas with typical landscape features in the Top End of the Northern Territory, Australia, which is bounded by longitudes 131o48'E, 132o27'E and by latitudes 13o41'S, 14o17' (Figure 1).
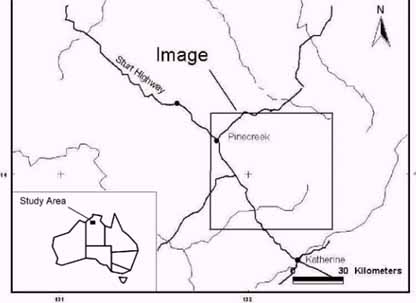
Figure 1. Location of the Study Area (Yinberrie Hills, Northern Territory, Australia)
The study area occupies the west part of Nitmiluk National Park and is close to the southwest boundary of Kakadu National Park that is inscribed in the World Heritage list for both its cultural and natural values. The major land uses in terms of area are Aboriginal land, pastoralism and nature reserves. The regional climate is characterised seasonally by rainfall with over 90% occurring in the summer wet season (from November to March). The average rainfall is 1 200 mm. Maximum daily temperatures average above 30oC over the year (Russell-Smith et al 1995). The wildfire pattern in the study area is characterised in terms of burning period during the dry season. The rugged Arnhem Land plateau exists in the east part of the study area with an elevation below 400 m. An undulating Cainozoic plain stretches away from the plateau margins and is composed of weathered and coarse-grained sediments (Williams 1991). An open forest/woodland type dominated by Eucalyptus spp. over a typically grassy understorey is the main vegetation type, while other freshwater floodplain communities ranging from sedgelands to open forests dominated by Melaleuca spp. distribute along the creeks in lowlands (Wilson et al. 1990, Russell-Smith 1995).
3. Methodology
In this project, one georeferenced Landsat Thematic Mapper image was acquired in June 2000 to demonstrate an operational method for the accurate mapping of fire scars that can be employed to extract a fire history for the past decade using this data. The accuracy assessment is based on field data and an IKONOS high-resolution data acquired within one week of the Landsat data. A 9-second Digital Elevation Model (DEM) acquired from Australian Survey and Land Information Group was available for the study area.
The interactive approach developed here employs a two-tired approach as can be seen in the flow diagram (Fig 2). On one hand, a conventional pixel-based, spectral classification is carried out to identify potential fire areas. On the other hand, areas that can be recognized as fire scars by the operator are manually delineated to provide the coverage of definite fire areas. The spectral classification is based on an unsupervised ISODATA algorithm of Landsat TM bands 3,4, and 5 generating 100 spectral classes. Considering that vegetation is highly sensitive to fire, the visible red, NIR and MIR bands were used in the image classification process, since this band combination has widely been used as a standard in vegetation studies (Conese and Maselli 1993). Each of the resulting classes is displayed on top of the false colour composite and assessed as being a fire scar or other land cover. This process is supported by available field data and the DEM to indicate potential water bodies and shadow areas. The classes are then aggregated to a binary image containing a value of '1' for all pixels that are potentially affected by fire. The manual delineation of definite fire areas was achieved by digitising the boundaries from the enhanced false colour composite with the help of field knowledge and the DEM. The boundary of fire patches was followed as closely as possible, attempting to eliminate shadows, water bodies, and other topographic features that may spectrally overlap with fire signatures. The digitised map was converted to a binary image with a value of '1' for the identified fire areas. The final fire map is produced by multiplying the binary maps from the classification and manual masking process.
In this project, two types of data were used to carry out accuracy assessment. Ground-truthing data were collected by recording fire locations and its coordinates in each 50 m interval by walking along four transects of 5 km length each set up uniformly in the study area. This fieldwork was carried out at the time of Landsat TM image acquisition. A total of three hundred field observations was used to assess the overall accuracy rate of fire mapping. Additionally, five hundred random points were tested on the high spatial resolution IKONOS data.
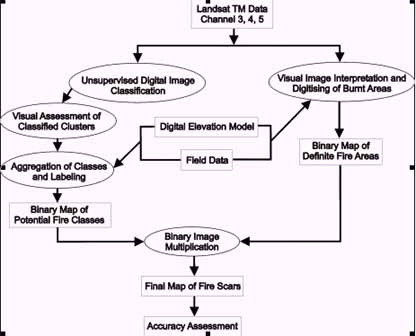
Figure 2. Flow chart of image processing steps for fire mapping in Australian savannas
4. Results and Discussion
The unsupervised spectral classification resulted in extensive confusion between fire classes, water bodies, shadows, and other topographic features such as mixed pixels in catchment areas where vegetation signatures are dominated by standing water. A more detailed classification, possibly using more spectral bands could be implemented, but there is doubt as to whether the problem could be solved. The real difficulty in this task is the nature of the fire scars to be mapped. Within the study area, the frequent fire events throughout the dry season lead to a great spectral variation to be tackled in the classification process. The fires in this environment burn the dry grass, but leave the sparse tree canopies unaffected. Thus the spectral signature is a mixture of the canopies and the burnt grasses, which are black at first, but rapidly, become lighter as the ash disperses, and eventually show signs of re-growth. For this reason, a relatively large number of spectral classes were generated to minimise the spectral overlap, but a more sophisticated classification methodology was not followed as its main goal is to become operational for the mapping of long-term fire history. The binary map of potential fire classes is shown in figure 3A.
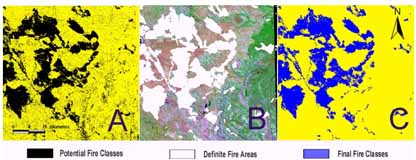
Figure 3. Binary maps of (A) potential fire classes, (B) definite fire areas, and (C) the final map of fire scars. The false colour composite is shown for reference.
Rather than attempting to devise a sophisticated classification methodology that may work well in some cases, the problem of spectral overlap was solved by utilizing the operator's knowledge of the study area and image interpretation. Manually digitising of fire scars has the major disadvantage of being time consuming, but on the other hand, it yields great accuracy in recognition, especially in conjunction with ancillary data and multiple images that are available for fire history mapping. Having a multi-temporal view allows recognition of permanent landscape features. There is a possibility that very small fire events of less than 10 pixels may be missed, but such events would be very rare in this environment. The problem in relying on this methodology is the accurate boundary delineation. To trace the outline accurately increases the time requirement very rapidly. For this methodology, it is important to be accurate in eliminating image elements that may be confused with fires. However, the boundaries do not have to be very accurate where distinct land cover features adjoin, as the spectral classification will resolve this boundary with the best accuracy possible for the data resolution.
The accuracy of the final map was 91% and 94% according to field data and IKONOS data respectively. Even though the overall accuracy rate assessed by IKONOS data was reduced because of some errors occurred in the visual interpretation, this method could be an easy and extensive approach for accuracy assessment. Some of the errors can be attributed to the time difference between the acquisition of Landsat TM image and the IKONOS data as there is a distinct possibility of several fire events occurring in a single week during the middle dry season. The methodology developed is subjective as it depends on operator knowledge, and moderately time intensive depending on the number of fire events present in the data, but it is robust as no radiometric corrections are required and produces highly accurate and reliable results. This is of great importance for fire history mapping, as there is no available ground truth for past image dates.
5. Acknowledgment
This study is a part of Yue Zhang's PhD project supported by Australian Cooperative Research Centre for Sustainable Development of Tropical Savannas and Australian Research Council Key Centre for Tropical Wildlife Management. Parks and Wildlife Commission of Northern Territory, Australia, funded acquisition of images. We are grateful for these supports. Thanks should also go to Mr Joshua Forner, Mr Craig Hempel, and Mr Andrew Edwards, for their field help and suggestions.
6. References
Chuvieco, E., and Congalton, R. G., 1988. Mapping and inventory of forest fires from digital processing of TM data. Geocarto International, 4, 41-53.
Conese C., and Maselli F., 1993. Selection of optimum bands from TM scenes through mutual information analysis. ISPRS Journal of Photogrammetry & Remote Sensing. 48, 2-11.
Jacklyn, P. and Russell-Smith, J., 1998. Proceedings from the North Australia Fire Management Workshop, Tropical Savannas CRC, Darwin, pp. 1-40.
Pereira, J. M. C., Chuvieco, E., Beaudoin, A., and Desbols, N., 1997. Remote sensing of burned areas. In: A review of remote sensing methods for the study of large wildland fires, edited by E. Chuvieco, Alcala de Henares, Spain, pp. 127-183.
Press, A. J., 1988. Comparisons of the extent of fire in different land management systems in the Top End of the Northern Territory. Proceedings of the Ecological Society of Australia. 15, 167-175
Russell-Smith, J., Needham, S., and Brock, J., 1995. The physical environment. In: Kakadu: Natural and Cultural Heritage and Management, edited by A. Press, A. J. Lea, A. Webb and A. J. Graham, Australian Nature Conservation Agency and North Australia Research Unit, Australian National University, Darwin, pp. 94-126
Russell-Smith, J., Ryan, P., and Durieu, R., 1997. A LANDSAT MSS-derived fire history of Kakadu National Park, monsoonal northern Australia, 1980-94: seasonal extent, frequency and patchiness. Journal of Applied Ecology, 34: 748-766.
Williams, M. A. J., 1991. Evolution of the landscape. In; Monsoonal Australia: Landscape, Ecology and Man in the Northern Lowlands, edited by C. D. Haynes, M. G. Ridpath and M. A. J. Williams, Balkema, The Netherlands, pp. 5-17
Wilson, B. A., Brocklehurst, P. S., Clark, M. J., and Dickinson, K. J. M., 1990. Vegetation survey of the Northern Territory, Technical Report No. 49, Conservation Commission of the Northern Territory, Darwin, Australia.