| GISdevelopment.net ---> AARS ---> ACRS 2000 ---> Global Change |
Desertification Mapping Of
West Asia -A GIS and Remote Sensing Application
Hussein Harahsheh and
Ryutaro Tateishi
Center for Environmental Remote Sensing (CEReS), Chiba University
1-33 Yayoi-cho, Inage-ku, Chiba 263, Japan
Fax: +81-43-290-3857
Email: hussein@ceres.cr.chiba-u.ac.jp /tateishi@ceres.cr.chiba-u.ac.jp
Center for Environmental Remote Sensing (CEReS), Chiba University
1-33 Yayoi-cho, Inage-ku, Chiba 263, Japan
Fax: +81-43-290-3857
Email: hussein@ceres.cr.chiba-u.ac.jp /tateishi@ceres.cr.chiba-u.ac.jp
Key Words: Remote sensing, GIS, Desertification, Assessment, Mapping
Abstract:
In the context of the constitution of environmental GIS database of west Asia, satellite remote sensing and GIS technology were applied as essential tools to address important aspects of environmental monitoring. A multi-temporal analysis of satellite derived monthly vegetation index data allows to create a land cover map of the study area. The land cover map with satellite images of NOAA AVHRR formed the basic elements of the environmental GIS database. The GIS is constructed in such way to envelop all necessary environmental layers (soil, geology, rainfall, elevation, temperature, moisture, albedo…etc). These layers were digitized and geo-coded to fit with latitude and longitude coordinates system as well as with the original satellite images representing the study area. Based on this environmental GIS database a desertification assessment and mapping was achieved. In order to analyze the desertification phenomena and other environmental parameters in the study area a layer of Environmental Mapping Units (EMUs) was prepared. The EMUs layer was formed using the land units layer, land cover classes and country area. Several desertification maps were produced, which reflect the desertification types persist in the study area: wind erosion, water erosion, vegetation degradation and salinization are the basic desertification maps, others are combinations of these basic maps. In term of statistic analysis 31% of the total land area (6.615 million km2) is considered as sand or sand dune, and not included in our analysis of desertification. About 27% has a slight to moderate desertification and 42% of the total land area is facing a severe to very severe desertification.
1. Introduction
Environment is considered as a worldwide phenomenon, which is characterized with sensitive equilibrium between its components; water, air and soil. The changes that take place in many areas of the world, as a result of human and other natural activities, could have the greatest impact on the environment.
The main goal of this research is to enable countries affected by desertification and drought to be associated with the generation of knowledge and techniques related to remote sensing and GIS, which are needed to solve their specifics problems in field of desertification control. And thus, to contribute to a better natural resources management and economic development.
2. Land cover of West Asia
The main land cover types occurring in the study area are listed in Table 1. Where we note that about 30% of the studied area (6653037 km2) are desert or desert rangeland and 32% is sand or sand dune. Followed by the permanent rangeland or marginal land, which represent 20% of the study area. The forest coverage constitutes 3.5% of the study area. The agriculture activity is divided into two main forms: irrigation activity and arable land, which represent 5.2% and 8% of the study area respectively.
3.0 Methodology
The environmental studies involved many types of parameters and variables, which are all dependant on each other, these variables could be related to water, land, atmosphere and people. So an integrated approach used remote sensing and GIS is the best methodology to take in consideration all aspects of environmental study, which is the case in this study.
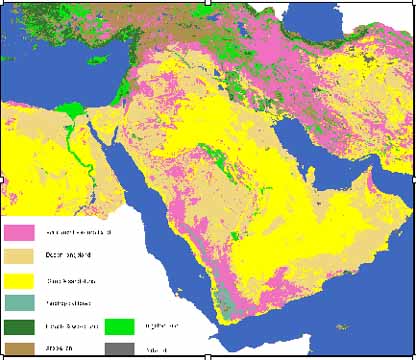
Figure 1: land cover map of West Asia
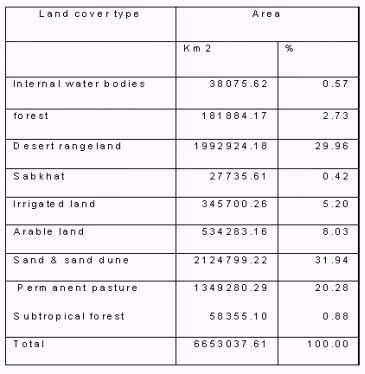
Table 1: Land cover of the study area
The aim of this part of study is to construct a Geographic Information System containing environmental parameters influencing the regional and global changes, with focus on desertification/ land degradation problems in West Asia. More than 70 layers of information were collected or calculated then geo-referenced and entered into the GIS system.
These layers belong to five types of data:
- land cover, natural vegetation and ecosystems maps
- Soil types and derived soil properties (texture, organic matter, PH, Nitrogen %, …)
- Climatic data: includes rainfall (average of 50 years), potential evapotranspitation, aridity index and air temperature.
- Topographic data: digital elevation model (DEM) and derived data such slop, aspect , shaded relief, drainage network and elevation zones.
- Satellite data: 10-days composite data set of NOAA AVHRR 1 km resolution covering the period from April 1992 through March 1993 and others data on the period of 1995 and 1996. Monthly NDVI data, Average NDVI, Land surface temperature and albedo Vegetation condition Index (VCI =(NDVI - NDVIMIN)/(NDVIMAX-NDVIMIN)), etc.
- Land degradation and desertification layers (Wind erosion, vegetation degradation…)
- Socio-economic data
5. Environmental Mapping units - EMUs-
In order to construct the database for the prepared GIS layers, it is very important that this database represents a set of polygons or units describing the environmental characteristics of such units, we called this Environmental Mapping Units-EMUs-. This is called also Desertification Mapping Units (DMUs) when it is related to desertification mapping. Here we choose three factors to build up the database units: soil units, land cover classes and country area. In total we obtained 502 EMUs, which represent unique physical mapping unit, unique land cover class and belong to one country. Under the "Idrisi software" GIS and database structure, we extracted all the information from the GIS layer based on the EMUs, then information filled in to the database.
6. Desertification assessment and Mapping
6.1 Introduction
The problem of desertification in arid and semi arid areas has a long history through the past centuries. It has always been an overlap of long-term changes in climate and human activities. With the rising population and, therefore, growth in consumption of the very limited resources, scope and intensity of interface with ecosystems by human activities grow rapidly, leading to sever degradation of vegetation, soil and water resources, which compose the natural resources of human existence. In fact United Nations by its organizations defined the desertification as the land degradation of dry, semi dry and dry humid lands caused by human activities and natural causes. This study emphasizes on desertification processes, causes and indicators occurring in west Asia, then desertification mapping, assessment and monitoring.
6.2 General Criteria of desertification assessment
Criteria for desertification assessment must take in consideration the local conditions of the study area. These conditions should be investigated through field observations, with the help of remote sensing tools. The results of such investigation can be interpreted according to the type and degree of desertification. The types of desertification considered in this study are as follows: Vegetation cover degradation, wind erosion, water erosion and soil salinization
Criteria for the assessment and small scale mapping of desertification were developed for each land use type. The following categories of land use were identified: forest/woodland, rangeland and meadow, dry agriculture and irrigation agriculture. Because absolute figures of these characteristics vary from region to region, the criteria are given in relative figures (for example, percentage of the area covered with moving sand dunes or vegetation) (Kharin, 1999). Examples of criteria used for desertification assessment are: Plant community, percentage of climax species, decrease of total plant cover, loss of forage on rangeland, percentage of area covered with sand dunes, type of water erosion in percentage, Removal of topsoil horizon of arable land, Blow-outs of the area, loss of yield of main crop in percentage, Salinity of ground water, salinization, Salinity of irrigation water, Salt accumulation. For developing the criteria, desertification maps and experimental data collected in study area were used, as well as literature sources. We should be clear that these criteria are still more theoretical and the application is not always possible. To some degree of accuracy we could used some of these criteria, and some times we used criteria, which are related and have linear relationship with these criteria mentioned on above.
6.3 Desertification Assessment and Mapping
6.3.1 Methodology
The assessment of desertification, which we fixed in four forms: vegetation degradation, water erosion, wind erosion and salinization, needs the combination of several factors or criteria. This could be achieved only by the use of GIS tools. Generally we have a scatter information about criteria of desertification, which are distributed over the study area, and to extend these information over whole the study area we developed linear models with one or two variables. So we have generally for each criterion an image layer in which its gray level values represent different degrees of importance of the criterion. This methodology makes the combination of criteria within the GIS framework logic and easy. The final result of each desertification map has to forms one with range of 0-255 values and another one with four degrees of desertification: slight, moderate, severe and finally very severe degree of desertification, this make it easier to interpret the results. The method of mapping will be explained for each type of desertification separately.
6.3.2 Vegetation degradation mapping
For the vegetation degradation mapping we consider the two main indicators or factors: decrease of forage productivity and decrease of the percent of vegetation cover. The analysis of vegetation degradation was achieved through the following steps:
Step1: Decrease of forage productivity:
As we mentioned above there is a general decrease of production of dry matter for livestock. To convert what we have of information about the decrease of forage, we consider that this decreasing could be linked to two variables: the intensity of livestock and the vegetation index (NDVI). We defined the intensity of livestock as the number of heads per hectare of area (rangeland area). We calculated this intensity for the year of 1961 and 1999, and so we obtained two layers map of livestock intensity, then the difference of two periods give an indicator of the increasing of intensity of livestock. Here we assume that this situation reflects the intensity of overgrazing, a phenomena, which is considered to be the most important cause of vegetation degradation and consequently of desertification.
By a multiple regression calculation we obtained the following model:
F = 68.45 + 1.744 * L - 333.46 * NDVI
F: Decrease of forage in percentage
L: increase of livestock intensity
NDVI: Normalized difference vegetation index (NOAA AVHRR data 1km resolution, average of the period April 1992 through march 1993)
Using this model we calculated the first indicator image of vegetation degradation. This indicator was divided into four classes according to the criteria of desertification assessment.
Step2: Decreasing of vegetation cover percentage
The percentage of vegetation cover decrease is highly related to the Normalized Difference Vegetation Index (NDVI). In this study we used a model developed by Purevdorj (1998) to calculate the vegetation cover percent from the NDVI:
Vegetation Cover (%) = -4.337 - 3.733 * NDVI + 161.968 * NDVI2
The calculation was achieved for two periods on 1980s and 1990s. For the period of 1980s, we used an average of five years data of NOAA AVHRR 8km resolution, and for the second period the 1km NOAA AVHRR of the period of April 1992 through March 1993. Then the decrease on vegetation cover percent image was obtained by the difference of the two periods. The output image was scaled to values between 0 and 100, then divided into four classes according to criteria.
Step3: Integration of indicators
The decrease of forage productivity image and the decrease on vegetation cover percent image were combined to produce by overlapping the vegetation degradation image. This result contained 16 combinations possible, which were reduced to four classes by a decision rule from slight degree of degradation to very severe degree of degradation see Table 2 and Figure 2.
6.3.3 Soil Erosion and Salinity
in the same way as vegetation degradation, the wind erosion, water erosion and salinity maps were achieved, but with different criteria and paprameters.
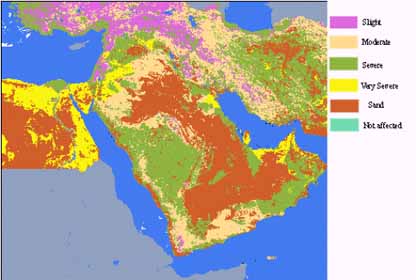
Figure 2: Vegetation degradation
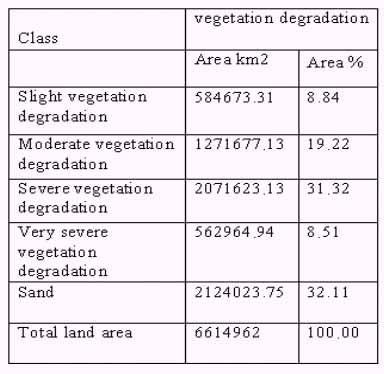
Table 2: Vegetation degradation of West Asia
There are many methods to integrate these results; here we adopted a procedure that gives an important result in all its systematic steps:
Step 1: As the wind erosion and water erosion are considered to have the same effect and shape, which is soil erosion, so we integrated the wind erosion and water erosion in one maps, which has originally 16 combinations of "soil erosion classes". In this step we need to take decisions to group these combinations into four classes of importance regarding soil erosion.
Step 2: The soil erosion affects directly the vegetation cover, and it is consider as main cause for vegetation degradation. Therefore in this step we integrated the result of step 1 with the vegetation degradation map obtained previously in the same manner as in step 1, and we obtained an intermediate desertification map with four classes explaining the degrees of desertification.
Step 3: Finally we integrate the result of step 2 with the salinization map, this combination gives 16 classes as a logic operation of intersection. Then these classes are grouped into the final classes of desertification (Table 3). Figure 3 show the final map of desertification in West Asia.
5.4.6 Desertification Assessment
The total studied land area is about 6.46 millions square kilometers, 33 percent are classified as sand or sand dune land, and generally located in extra arid environment, which is theoretically excluded from desertification assessment. But we included the sand area, which is under irrigation activity as part of salinization assessment.
The study shows that 55% of West Asia is affected by moderate to severe soil erosion, which represents about 3.58 millions square kilometer. This area losses of its topsoil material from 50 to 150 tones per hectare per year. The vegetation degradation statistics show that it has the same range of importance as soil erosion, in fact 50 % of land are subject to moderate to severe vegetation degradation. Here we can clearly interpret the loss of topsoil by the degradation of vegetation cover, which is important factor to prevent the removal of topsoil material. The salinization mapping shows an important distribution severe and very severe salinization in the irrigated areas and others areas, which have problems of waterlogging and increase of water table level (world atlas, 92). Table 3 shows that about 266,000 km2 are affected by severe and very severe salinization, which constitute a 75% of the potential of irrigation area in West Asia.
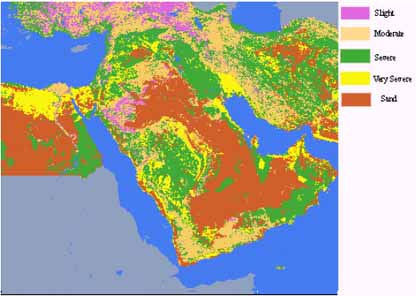
Figure 3: Desertification map of West Asia
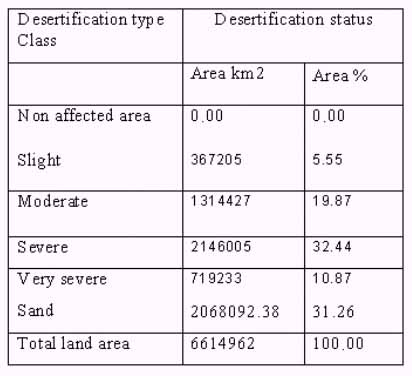
Table 3: Desertification classes in West Asia
Conclusion
We found a big lack in desertification mapping techniques using remote sensing and GIS. And few studies were conducted to map desertification using such tools and methodology. An Integrated Approach is utmost important for desertification study, which reflect the complexity of desertification process. So the desertification assessment in this study is the output of a combination of social factors, economic factors, climatic factors and physical factors. Development of standard methods and criteria is needed for desertification studies. Also there is some lack in the definition of desertification, and needs some improvement, where it is important to include the socio-economic factors when the delineation of area susceptible to desertification.
Finally the statistic results of this study show the gravity of desertification problems in all levels. It is supposed that all the area is subject to desertification, mainly by vegetation degradation process, where 40% of study area is severely and very severely affected by vegetation degradation, followed by wind erosion process (27% severe and very severe wind erosion). So we conclude that 6% of land area in West Asia is slightly desertified, 21% is moderately desertified, 31% is severely desertified and 11% is very severely desertified. Without doubt these results show the gravity of desertification problem in the study area.
References:
Porevdorj T, The estimation of percent green vegetation cover using AVHRR data-Application to Mongolian grassland-, 1998, Graduate School of Science and Technology/Chiba University.
Tubengen Atlas of Middle East, Tubengen University, Stuttgart, Germany, 1978-1987. 30 p.
World atlas of desertification. UNEP, 1992, 69 p.