| GISdevelopment.net ---> AARS ---> ACRS 2000 ---> GIS & Data Integration |
Dynamic Spatial Modeling
using ROS and Carrying Capacity for Ecotourism Management
Kampanart Piyathamrongchai and Nitin K. Tripathi
Space Technology Applications and Research, School of Advanced Technology
Asian Institute of Technology, PO Box 4 Klongluang, Pathumthani, 12120, Thailand
4-6-1, Meguro-ku, Komaba, Tokyo 153-8505 Japan
Tel(66)-2-524-6392, Fax (66)-2-524-5597
Email: kampanart@nu.ac.th, nitinkt@ait.ac.th
Key Words: Dynamic, Spatial, Tourism, Carrying Capacity, GIS, ROS
Abstract:
In general, any geographic phenomena are visually depicted as 'static' map with 'static' spatial model. This paper presents how the time variable can be combined to give more information to the spatial model and how to implement the dynamic map with dynamic spatial model. The recreation opportunity spectrum (ROS) framework is a method to identify the tourism carrying capacity (CC). It is modeled spatially as well as dynamically.
Conceptually, there are four steps to implement the dynamic spatial modeling for tourism carrying capacity including computer simulation, spatial analysis, DSM interfacing and verification. Avenue script on ArcView GIS package was used to implement. The simulation of traveling of tourists is implemented based on parameters such as route for tourist, speed of car and stopping time in each facility from field observation. The spatial analysis dynamically applies to the ROS and CC evaluation using cartographic modeling. Three settings are layered and weight scores defined including physical, managerial and social. The programs developed are generally interactive with dialogue interface. User can flexibly set up different scenarios for supporting the decision.
For the result, sequential ROS class maps, CC exceed maps and the CC exceed level can be generated. The information obtained from the analysis in this work will be useful to control the impact of tourism on each facility of the Phuhinlongkhla National park and provide more comfort to the tourist.
1. Introduction
"A great part of the challenge of modeling interactions between natural and social processes has to do with the fact that processes in these systems result in complex temporal-spatial behavior" (Itami, 1994)
Geographic phenomena are depicted as a 'static' map displaying information of the real world. The static-maps can be produced using the geographic information system (GIS) as a powerful tool to create complex spatial model. Efficiently, cartographic modeling with overlay and weight procedure is still a popular method to offer visual information from many layers of map represented any geographical features or events.
Static-maps are depiction of land use or other information at a particular time but geographic process are dynamically. Time-based approach is nowadays included to many fields of researches. Spatial modeling is one of research fields that undertake the need of the time. The spatio-temporal approach is provided due to the merits of information given from time applied to spatial model. The temporal GIS database is also set up. Then the 'dynamic spatial modeling' framework that uses both of time and spatial information to create any models give different results and is implemented.
There are three fold frameworks applying in this study. Firstly, computer simulation is performed. The key features of simulation are input, algorithms and output (Maquire 1989). In this study, the computer simulation is developed collecting parameters from traveling of tourists in the park. Those parameters are applied using some basic concept of system dynamic. Secondly, cartographic modeling technique is set as spatial modeling in this study. GIS package nowaday provides a lot of spatial operations is chosen as tool for spatial analysis. The third aspect, tourism carrying capacity (CC) is a spatially dynamic application. The impact of visitors traveling in Phuhin Longkhla National Park is simulated and evaluated. Recreation Opportunity Spectrum (ROS) framwork was defined in this study.
2. Dynamic Spatial Modeling Implementation
The questionaires were designed for collecting the information: general information, satisfaction to the tourist place of tourist and the most important is time spending information. Those raw data from field survey were analysed.
Two practical frameworks were integrated included computer simulation and spatial modeling applying for tourism carrying capacity. This section explains the detail of each procedure to implement.
2.1 Computer Simulation
Step 2 Tourist parameter. For generating tourist parameters to the simulation, the range of time, which tourists start to travel in the park, was defined. The range of time was taken as randomly for programming. Each tourist group adopts random number of people for that group.
Step 3 Movement algorithm. Route maps prepared in UTM coordinate system was converted to percent unit. For example total length of a route is equal to 10,000 meters. 10,000 meters was converted to 100 percent. According to the speed of car and distance to move the object, the step in percent unit can be calculated. The current position of a moving object was updated with the step when the time calculated from the speed was changed.
Step 4 Stop and time spending algorithm. Time spending information from field observation is important for this step. The range of time spending can be calculated from mean and the standard deviation of time spending. While the movement algorithm is running and the moving object passes a tourist point, random stopping time is defined. The object stops at that point until the stopping time finish.
Step 5 Output generation. Time stamp to output the simulation information can be defined such as 15 minutes. The algorithm for generating two types of output was designed included text file and variable used for spatial analysis.
2.2 Spatial Analysis
The spatial model was applied based on the attribute-based approach. Algorithms and programming codes were developed purpose for creating and adjusting the value inside the spatial database. The main input for spatial analysis is from computer simulation. Steps for complete spatial analysis part is shown follows.
Step 2 Algorithm for recalculating the ROS class and CC exceed class. Each time stamp, each tourist point has different amount of tourists. Social weight score can be computed according to the number of visitors. For ROS score updating, the attribute-based model was performed in this step. The algorithm to access the ROS attribute to get ROS score was performed. Initial stage ROS score is updated from social weight score and reclassified to 5 classes of ROS.
For CC exceed map, the initial stage ROS class and updated ROS class were accessed. Based on CC concept, the ROS class change matrix was created.
Step 3 Output generation. The algorithm to create the ROS class and CC exceed maps in sequential files was developed. Quantitatively, the area-based approach was applied to calculate the CC exceed level. The text file is created for writing the CC exceed level in time stamp.
2.3 Dynamic spatial modeling interfacing
Integrating the two main procedures, computer simulation and spatial analysis, graphic user interface (GUI) was designed. Consequently, input, adjustable parameters, and alternative output were proposed and programmed connecting to the main module.
2.4 Simulation and model testing
For testing the DSM, different scenarios can be set up for evaluating the result the simulation and spatial model. Variety for number of groups, range of people per group and the social weight parameter method were defined.
3. Result and Discussion
Much of programming coded lines were written re-conceptualizing the framework in the last section. The visual result provided the ROS class maps and carrying capacity (CC) exceed maps, which were generated over the time simulation. Quantitatively, an index used for indentifying the exceeding of carrying capacity was generated in form of text file.
Testing of models with different scenarios in the real world was performed. Different number of visitor groups and different range of number of people per group scenarios can be set up. For instance, the simulation results are shown as graphs in Figure 1. Figure 1 a) demonstrates the increasing range of time to use Third world tourist area. And Figure 1 b) illustrates the Lanhintaek group traveling that if there are a few group, the traveling will be discretely. However, this area tend to incessant use, the time period changed from 45 minute - 2 hours to be 45 minutes to after 8 hours passing.
Figure 2 represents the ROS class map and CC exceed map of 50 group compare with 100 tourist group in Phuhin Longkhla National Park after 6 hours of simulation. Figure 2 b) and d) illustrate the CC exceed map created based on the acceptable change of ROS class map (Figure 2 a) and b) respectively). More groups travel in the National Park cause more impact to tourist points.
CC exceed map not only visually represents the impact of tourists over the time, but also can be used to calculate the CC exceed level. The result shows an index of carrying capacity of any tourist point and peak period time. Figure 3 depicts graphs created using the information of CC exceed level index and peak period time. Park manager can define the level of acceptable, for instance, the acceptable level is equal to 3 as shown as cross dotted-line in Figure 3
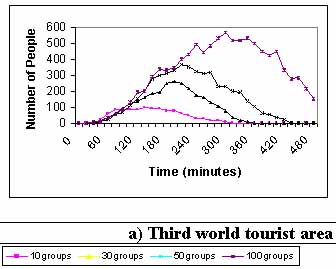 a) Third world tourist area |
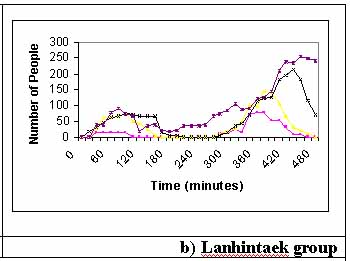 b) Lanhintaek group |
| Figure 1: Traveling pattern of two tourist points | |
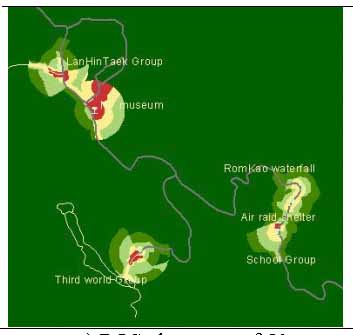 a) ROS class map of 50 groups |
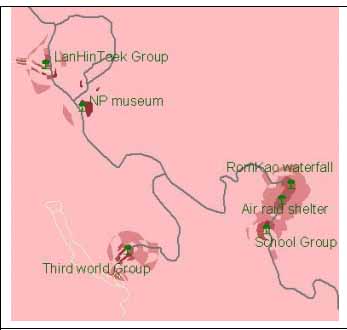 b) b) CC map of 50 groups |
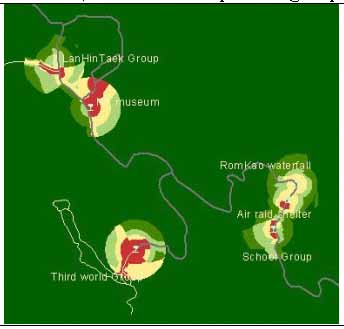 c) ROS class map of 100 groups |
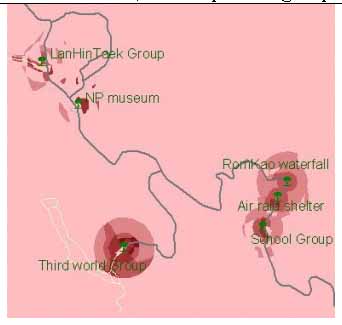 d) CC map of 100 groups |
 Figure 2: ROS class and CC map after 6 hours of 50 and 100 groups simulation | |
4. Summary and Conclusion
Dynamic spatial modeling (DSM) offers clear view of 'where' and 'when' a phenomena occurs. This study represented the integration of computer simulation and spatial analysis. Computer simulation yields the real time information of number of visitors in each tourist point. Integrating spatial analysis yields more closely to the impact of tourist to the natural resource.
The attribute-based approach is more easier and faster to manage the information. Linking of attribute table to the spatial is useful for visualization in form of map and graph.
Nowaday, GIS softwares are equipped with the programming interface. Therefore, the simulation program can be performed using only one package. It will be very useful and effective technology.
DSM for Tourism Carrying Capacity can answer questions for example, "where is the area which has exceeded the carrying capacity at 1.00pm?" and "How does the exceed in this area is comparable to another at 2.00pm?" etc. These scenarios are very useful for ecotourism management. The result from this study will provide necessary CC exceed information for better management of tourist places.
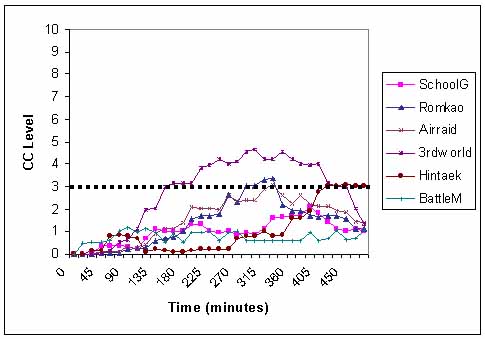 Figure 3: Graph illustrates the CC exceed level of 100 groups simulation |
5. Reference
- Aronoff, S. 1993 Geographic Information Systems: A Management
Perspective. WDL Publications, Canada.
- Itami, R.M. 1994 Simulating spatial dynamics: Cellular automata
theory. Landscape and Urban Planning, 30:27-47.
- Maquire, D.J. 1989. Computers in Geography. Longman Group Limited,
Honk Kong.
- Payne, R.J., Carr, A., and Cline, E 1997 Assessing Visitor
Opportunities in Two National Parks. School of Outdoor Recreation, Parks
& Tourism Lakehead University, Thunder Bay, Ontario Canada [WWW
document] URL http://parkscanada.pch.gc.ca/library/Ros/english/tdm_e.htm
- Yuan, M. 1996 Temporal GIS and Spatio-Temporal modeling. [WWW document] URL: http://ncgia.ucsb.edu/conf/SANTA_FE_CD-ROM/sf_papers/yuan_may/may.html