| GISdevelopment.net ---> AARS ---> ACRS 2000 ---> GIS & Data Integration |
Application of Geoinformatics
on Mountain Land Hazard Mapping:
A Case of Annapurna Himalayas, Central Nepal
Krishna Poudel
Department of Geography, Tribhuvan University, Prithwi Narayan Campus, Pokhara, Nepal
P.O. Box 214, Pokhara, Fax ++977-61-25200
Email: gislab@pngeog.mos.com.np
A Case of Annapurna Himalayas, Central Nepal
Krishna Poudel
Department of Geography, Tribhuvan University, Prithwi Narayan Campus, Pokhara, Nepal
P.O. Box 214, Pokhara, Fax ++977-61-25200
Email: gislab@pngeog.mos.com.np
Key Words: Mountain, Instability, Landslide, Human welfare, Sustainable development.
Abstract
Nearly one-fifth of the world's land surface is under the mountainous topography. There is a grievous coincidence of weak and vulnerable poor people, limited availability of resources, and fragile surface conditions, which causes the processes or conditions that may initiate and are often the main, immediate causes of damage. For the betterment of the human lives and their welfare, it needs to give the appropriate knowledge about the possibilities of hazard and to provide them the better alternatives. For the analysis two different methods have been applied. The method-1 is designed to give a general spatial association of different factors of the surface. The method-2 is applied for the computation of the Landslide Susceptibility Score (LSS). Based on these methods, the possible hazard prone areas of the region have been delineated. 13.8 percent of the 304 total settlement units of region are over the very high hazard-prone parcels. Field verification also confirmed the results depicted from the map analysis.
1. Introduction
Nearly one-fifth of the world's land surface is under the mountainous topography. Weak geological structure, steep and rugged surface, high altitude variation along with seasonal monsoon triggers result the high degree of fragility in the whole Himalayan territory (Bhandary, 1987: 1-88). Even under those fragile parcels of land a significant number of people are residing and adapting atypical socioeconomic activities. Those people are eking out their life support-bases from those fragile units of land. There is a grievous coincidence of weak and vulnerable poor people, limited availability of resources, and fragile surface conditions, which causes the processes or conditions that may initiate and are often the main, immediate causes of damage. Landslide is one of the most visible and commonly perceived destructive phenomena of most of the hill-slope in the mountain watersheds. For the betterment of the human lives of those who are residing over such surface conditions needs to provide appropriate knowledge about the possibilities of probable hazards and to give them the better alternatives in their conventional activities which might be essential steps for the human welfare and sustainable development. Present study is designed to identify the fragile parcel of land of mountainous topography in a micro spatial scale and suggestion have been made to reduce the possibilities of human vulnerability on those specific units.
2. Study Area
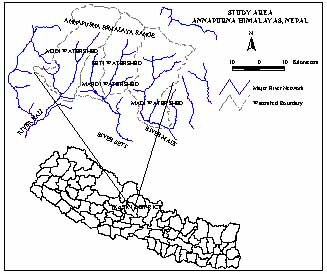
The study is concentrated on the upper part of the four perennial river basins Modi, Seti, Madi and Mardi of Annapurna Himalayan Range, Central Nepal. Geographically the region is extending from 28°13' north to 28°37' north latitude, and 83°43' east to 84°16'east longitude (Figure 1). The region covers an area of 1450 square kilometers. The area is extending nearly from 600 m asl at the lower part to 8000 m asl at the higher ridge. The area includes human settlement zone at the lower part, seasonal grazing at the middle part and permanent snow cover at the upper part.
Geomorphology of the region is characterized by the morphometry of the major river network systems. Upper part of the four major rivers and their numerous tributaries drain the area. The permanent stream network depicted in the 1:63,360 scale topographic map with 100 ft (30.56m) contour interval have been digitized in ARC/INFO PC-based vector GIS and calculated some morphometric parameters of the region (Table 1).
| CHARACTERISTICS | WATERSHEDS* | |||
| MODI | SETI | MADI | MARDI | |
| Area (km2) Perimeter (km) Number of stream segments Order of trunk river Length of the trunk river (km) Total length of stream segments (km) Mean length of 1st order stream (meter) Average drainage density (m/km2) Mean bifurcation ratio ( Rb = NU/NU+1) Mean length ratio (RL = LU/LU-1) |
476.92 125.4 1236 5TH 31.62 1057.76 733.98 2217.91 5.7 2.911 |
342.63 87.01 1090 6TH 27.06 896.55 701.48 2616.69 4.071 4.5 |
502.31 118.16 1543 6TH 28.70 1239.23 741.42 2467.07 4.282 3.053 |
140.69 58.17 377 5TH 12.03 373.81 888.25 2656.99 4.183 2.10 |
3. Methodology
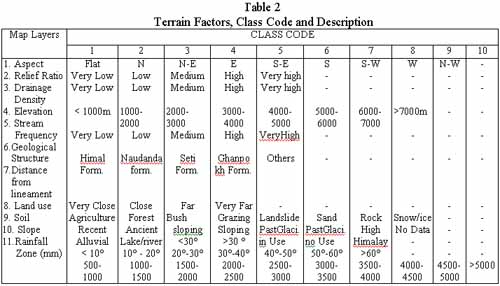
For the assessment of the terrain two different methods (method - 1 and method - 2) are applied. The method - 1 is designed to give a general spatial association of different factors, which are perceived as major determinants of the surface fragility as well as database available in the case of Himalayan watersheds. Eleven different map layers including geological lineament, lithology, altitude, relief ratio, slope inclination, soil, land use, stream frequency, drainage density, aspect and rainfall zone, and seventy-five classes of these factors have been considered (Table 2).
|
All these classes were scored in a sequential order of possibility of failure according to the procedure in general scale of regional mapping (Marsh 1978). Certain weight has been assigned to them accordingly (Table 3). Annapurna Region has been classified into five respective classes of potential geomorphic hazard units.
| Map Layers | CLASS CODE | Weight | Total Score | |||||||||
| 1 | 2 | 3 | 4 | 5 | 6 | 7 | 8 | 9 | 10 | |||
| 1.
Aspect 2. Relief Ratio 3. Drainage Density 4. Elevation 5. Stream Frequency 6. Geological Structure 7. Distance from lineament 8. Land use 9. Soil 10. Slope 11. Rainfall Zone |
0.1 0.3 0.3 0.5 0.3 2 4 2.2 0.2 0.2 0.1 |
0.1 0.7 0.7 1 0.7 0.5 3 0.1 0.3 0.8 0.2 |
0.5 2 2 1.5 2 4 2 1.5 3 1 0.5 |
1 3 3 1.8 3 1.4 1 1 3.5 1.5 0.7 |
2.5 4 4 2.2 4 1 0 3.5 2 1.8 0.8 |
2.5 0 0 3 0 0 0 0.5 0.5 2.2 1 |
2 0 0 3 0 0 0 1 0.3 2.5 1.2 |
0.8 0 0 3 0 0 0 0.2 0.2 0 2 |
0.5 0 0 0 0 0 0 0 0 0 3 |
0 0 0 0 0 0 0 0 0 0 3.5 |
7 10 12 2 12 5 10 10 8 12 12 |
70 100 120 20 120 50 100 100 80 120 120 |
The method - 2 is applied based on the previous studies made on this field. In this method, Landslide Susceptibility Score (LSS) has been calculated as suggested in the studies (Aniya, 1985: 102-114; Sarkar, Kanungo and Mehrotra, 1995: 301-309; Dhakal, Amada, and Aniya, 1999: 3-16). Accordingly:
Landslide Susceptibility Score (LSS) = R (L)/R (A) Where, R (L) = a ratio of the landslide area in a particular class of a factor to the total landslide area R (A) = a ratio of the area belonging to that particular class to the total study area
A score greater than 1 suggests that the class contributes to landslide, whereas a score smaller than 1 implies the class inhibits landsliding. In this procedures seventy-five different classes of eleven factors in total were considered. However, there were fifteen classes having null score (Table 4). The LSS of each class of the factors were linked with the vector coverage. That coverage was later on overlaid with each other to obtain the cumulative score. The score of overlaid layers were added linearly.
| Class code | Aspect | Relief ratio | Elevation | Slope | Geologic structure | Geologic lineament | Land use | Soil | Rainfall zone | Drainage density |
Stream frequency |
| 1 2 3 4 5 6 7 8 9 10 11 |
0.49 0.958 1.477 1.964 0.806 0.696 0.843 0.769 0.492 |
0 1.773 1.049 0.771 1.24 |
1.875 1.236 2.881 0.129 0 0 0 0 |
0.1 0.526 0.781 1.053 1.644 0.834 0.987 |
1.75 0.21 1.212 4.074 0.719 |
2.514 1.103 1.175 0.579 |
0.187 0.026 0.774 0.107 3.218 0.252 0 0 |
0 0 1.405 1.421 1.469 1.592 0.897 0 |
0 0 0 0.204 1.992 0.629 1.895 0.177 0.023 0 0 |
0.808 0.565 0.715 1.562 1.2 |
0.733 1.433 0.622 2.25 1.056 |
What is generally considered is the high susceptible parcel that accounts for higher score and the lesser susceptible parcel is the vice versa. The range of LSS obtained is classified into five zones of relative instability. Theoretical potentiality of the terrain instability is further verified by overlaying the existing landslide maps on the result of both method-1 and method-2 and calculated the LSS. Finally overlaying the potential hazard map with settlement and cultivation land has given the coincidence of possible hazard and vulnerability of human life and property.
4. Result and Discussion
Based on the analysis of method -1, about five percent of the total area of the region is under the very high potential hazard zone, whereas only 0.2 percent area of the total is in the very low potential hazard zone. Distribution of the proportion of total area of the region is skewed towards the potentially high hazard prone classes (Table 5). The analysis reveals that the Madi watershed has the maximum share of its area under the very high potential hazard zone. This follows the Mardi watershed. Though the Modi and Seti have smallest share on very high potential hazard zones, the share of high zone has considerably large proportion. The extension of very low potential hazard area is less than one percent to all watersheds. The pattern of distribution is normal to some extent, but it is skewed towards the very high potential hazard class in all four watersheds under studied. According to method -2, the highest susceptible score is delimited to the lithological structure of the Ghan-Pokhara Formation. This group of lithology is consisting the black carbonaceous slates, green shales and grayish shales, white dolomitic limestone and limestone. This group is closely associated at the MCT zone of the region. Therefore, the geological structure seems very fragile. Again the second highest LSS is concentrated in close proximity to the geological fault line, therefore, the landsliding phenomena in the region are closely associated with weak geological structure.
| Class | Hazard Class | Modi | Seti | Madi | Mardi | Total of the Region |
| 1 2 3 4 5 |
Very
Low Low Medium High Very High |
0.08 29.42 43.46 25.72 1.31 |
0.11 19.40 48.15 29.85 2.50 |
0.25 22.66 35.74 32.26 9.09 |
0.06 5.44 59.98 30.49 4.03 |
0.2 22.5 43.4 29.4 4.5 |
| Total | 100 | 100 | 100 | 100 | 100 |
Source: Computed from the Analyzed Map
According to this procedure, extensive area of the region is located within low and medium instability zones. Very low and very high susceptible zones have considerably small proportion of the total area. This analysis reveals that the Madi watershed has the highest proportion of its area under high and very high susceptible zones (Table 6). The proportion of areal distribution is quite small in very low susceptible zones of all watersheds. The large area is in the medium class of all watersheds. This analysis also shows a higher fragility at the Madi watershed. The Mardi watershed has a good proportion of land in lesser fragility classes. But, the Seti and Modi are in between trend.
| Class | Hazard Class | Modi | Seti | Madi | Mardi | Total of the Region |
| 1 2 3 4 5 |
Very
Low Low Medium High Very High |
0.26 52.29 43.92 3.53 0 |
0.15 50.8 43.38 5.63 0 |
0.20 34.90 51.55 13.32 0.02 |
0.00 27.51 65.71 6.78 0.00 |
0.
80 43.29 48.20 7.70 0.01 |
| Total | 100 | 100 | 100 | 100 | 100 |
According to this procedure, the method-1 has the highest failure rate at class five followed by class four to smaller class respectively. But at the method - 2, the failure rate is the highest one at class four and very small value at class third. And, the other classes have null score (Table 7).
| Class | Method_1 | Mehtod_2 | ||||
| R/L | R/A | LSS | R/L | R/A | LSS | |
| 1 2 3 4 5 |
0 0.044 0.331 0.478 0.144 |
0.002 0.225 0.435 0.294 0.045 |
0 0.196 0.761 1.626 3.200 |
0 0 0.177 0.821 0 |
.008 0.433 0.482 0.077 0 |
0 0 0.367 10.660 0 |
From the analysis of LSS, the method -1 seems to be quite a better indicator to depict the landslide hazard of the mountain region. However, the method -2 also has a good concentration of the high LSS at the fourth class. On the whole, the region has considerable area under the high fragility. Which shows that the resources over the region are in delicate situation in terms of its terrain condition. The analysis depicted that the result of method - 1 has quite uniform pattern, and it seems that the spatial character explains appropriately. In the regional scale, this technique tends to give convincing answer. Even for the comparison of LSS with the result of Method -1, it has given a better result. For the planning point of view, the settlement of the region has therefore, been overlaid over the possible hazard-prone areas resulted through the method-1.
According to this procedure, the spatial locations of 13.8 % settlements out of 304 settlements of the region are falling at the very high possible hazard-prone zone. Similarly, 37 %, 44.4 %, and 4.9 % settlements are located at high, medium and low hazard-prone areas respectively. The very low hazard-prone class has no settlement location. It might be because of tiny extension. Among these settlements Modi watershed has 5 settlements (i.e. Kimrong Khola, Uri, Yumle, Tallogaun in Ghandruk VDC, and Landruk, Dhawa and Lumle Bikas area in Lumle VDC). In Seti watershed 6 settlements (i.e. Meprang, Chyanglung, Khaimarang and Chipleti in Sardikhola VDC, Ghamtara and Khahare in Machhapuchhre VDC) are there. In Madi watershed, there are 25 settlements, which are in very high hazard-prone zone. Among them most vulnerable are Taprang, Khilang, Uppallo Namarjung, Pakhagaun of Saimarang VDC, Ghartidanda of Bhachok VDC, and Harse of Mijuredanda VDC. In Mardi watershed 4 settlements are in this zone, which are Kuji, Patikhola, Armalakot and Kamsekhorphedi.
The result depicted from the map analysis was further tried to verify during the field visit from January to March 2000. Generally the terrain instability is viewed under the direct observation of the concentration of landslide scars, topsoil loss and dissection of surface of the terrain. Among the four watersheds under studied, the Madi has a greater number of landslides with extensive coverage. In this watershed, Saimarang, Taprang, and Uppallo Namarjung were the most affected parts. The second large concentration of the landslide was in Modi watershed. Tanchok and Landruk village of Lumle VDC, Kyomrong Khola, Uri, and Kimche of Ghandruk VDC were the most affected area of that watershed. The severity of landslide in Seti watershed was not clearly visible. The catchment of Idi Khola has a large concentration in Mardi watershed. In terms of severity and loss of property, Madi watershed was the most affected ones. Causes of instability seems to its natural reasons, however, the human activities in the region were inducing to the natural processes. Khet terraces and open grazing were the most common location of the concentration of big slides. Maintenance activities of agricultural terraces were not properly done. Open grazing on abandoned agricultural terraces was further worsening the situation. Having abandoned the transhumance pasturing systems, concentration of livestock units near the human settlement was causing further deterioration the situation of land degradation. The process shows that the terrain of mountain watersheds is degrading severely even though the human population is less dense and also is reducing through out-migration. For the mitigation and preparedness, the settlements situated at the very high hazard-prone zone require the prompt attention. Precisely an operation plan is, thus, indispensable to human welfare and sustainable development in the region.
References
- Aniya, M., 1985. Landslide Susceptibility Mapping in the Amahta
River Basin, Japan. Annals of the Association of American Geographers,
75 (1), pp. 102 -114.
- Bhandary, R.K., 1987. Slope Instability in the Fragile Himalaya and
Strategy for Development. Indian Geophysical Journal. 17, pp. 1 - 88.
- Dhakal, A.S., Amada, T. and Aniya, M., 1999. Landslide Hazard
Mapping and the Application of GIS in the Kulekhani Watershed, Nepal.
Mountain Research and Development, 19 (1), pp. 3 -16.
- Marsh, M. W., 1978. Environmental Analysis for Land Use and Site
Planning. Mcgraw-Hill Book Company, New York, p.241
- Sarkar, S., Kanungo, D. P. and Mehrotra, G. S., 1995. Landslide Hazard Zonation: A Case Study in Garhwal Himalaya, India. Mountain Research and Development, 15 (4), pp. 301 -309.