| GISdevelopment.net ---> AARS ---> ACRS 2000 ---> GIS & Data Integration |
Integration and Application
of Socio-Economic and Environmental Data Within GIS for Development Study
in Thailand
Tran Hung, Yoshifumi Yasuoka
Institute of Industrial Science, University of Tokyo
4-6-1 Komaba, Meguro-ku, Tokyo 153-8505, Japan
Tel: +81-3-5452-6415 Fax: +81-3-5452-6410
Emails: tranhung@iis.u-tokyo.ac.jp
Tran Hung, Yoshifumi Yasuoka
Institute of Industrial Science, University of Tokyo
4-6-1 Komaba, Meguro-ku, Tokyo 153-8505, Japan
Tel: +81-3-5452-6415 Fax: +81-3-5452-6410
Emails: tranhung@iis.u-tokyo.ac.jp
Keywords: GIS, Information Integration, Development Study, Thailand
Abstract: Effective decision-making often requires information on various aspects of regional development, which is not so easily obtained, especially in developing countries. Beside the data paucity, the socio-economic information is very different in their geographic properties to those relating to the physical world. This paper presents a set of combined GIS procedures to integrate up-to-date information from remotely sensed data with demographic and socio-economic data in order to create a comprehensive spatial database for two fast-growing suburban areas in Thailand (Chiang Mai - Lamphun and Pathum Thani areas). Issues, which arise in the integration of disparate data sets such as scale and modifiable area unit problems, are addressed. Then, with a combination of logical and statistical operations, reliable data variables are derived to monitor and represent underlying factors of regional development in the study areas. An example of spatial modeling on urban-rural interactions demonstrates how the unified set of spatial and spatialized socio-economic variables can be used to gain insights into regional development problems. The paper also discusses other potential uses of the integrated database. The results of these case studies show that socioinformatics overcome the "data barriers" problem and can be successful in the developing world.
1. Introduction
Up-to-date and reliable information is vital for the management of a region's human and natural resources and for dealing with regional development decisions that have a spatial context (Klosterman, 1995). A comprehensive information base could reduce uncertainty and enhance decision-making. Managers and policy makers may wish to integrate social, economic and environmental data in order to formulate strategic development plans (Kliskey, 1995). In developing countries, however, the data barriers are still obvious due to both institutional and technical reasons. As institutional issues are being recognized and governments start to invest millions of dollars in collecting data, the data management and usage are still far from satisfactory level. Information on various aspects of regional development - social, economic and environmental data - is originally collected for different purposes, at different scales, at different time frames and with different underlying assumptions about the nature of the phenomena. This creates technical difficulties to the integration of social and environmental data, and explains the scarcity of successful empirical researches on regional development analysis in developing countries.
Recent technological advances in geographic information system (GIS) have made it possible to manipulate large amounts of geographic data and construct the topological structure underlying complicated spatial phenomena. As about 80-90% of data collected and used for regional and environmental information systems are related to geography (Huxhold, 1991), GIS provides such an integrated computing environment for social and environmental data integration. This paper addresses the data integration problem in regional development studies in Thailand. Results of spatial analysis are also presented to illustrate the usefulness of integrated spatial GIS database in gaining insights into regional development problems in Chiang Mai - Lamphun and Pathum Thani areas, Thailand. The data integration presented in this paper was conducted on the 'loose integration' between GIS (Arc/Info, Imagine) and developed Visual FoxPro routines.
2. Data Integration Issues
Originally, social, economic and environmental data are collected for different purposes, at different scales, and with different underlying assumptions about the nature of the phenomena. The subjects of environmental data often exhibit continuous spatial variation (e.g., elevation, soils, precipitation, and temperature) while social phenomena tend to be more spatially discrete (e.g., people, farms, factories and administrative units). The spatial physio-graphic data are normally available in the map forms from various mapping and surveying agencies. With rapid advances of remote sensing technologies during the last two decades, satellite imagery provides accurate and up-to-date information of the land surface, making the integration of remotely sensed data with other environmental and socio-economic data sets beneficial. However, in order to produce regional empirical models of urban-rural interactions, social and environmental data must be in a common format.
A variety of approaches to integrating social and environmental data exist namely: full integration, loose integration and parallel analysis. Among them, the loose integration appears to take most advantages of GIS systems (e.g., overlay and regional characterization techniques) while provide enough flexibility to a user (mainly planners or managers) in deriving information at desired administrative units (Brown, 1996). Conversions between areal units or the creation of new areal units, which represent the intersection of two sets of units, provide mechanisms for comparing disparate data. Data collected and aggregated to some spatial aggregation unit (e.g., Thailand's tambols) can be converted from those units to other spatial units through a variety of approaches. Areal interpolation can be carried out using techniques outlined by Tobler (1979), Flowerdew and Green (1989), and Goodchild et al. (1993). A common assumption for many of these methods is that the density of the count variable, or the value of a density variable, is constant throughout each of the units. As spatial units defined for environmental data are nearly always designed to be internally homogenous to some degree (e.g., soil units, land cover types), while socio-economic units are nearly always the product of some political process; they are administrative units. That so-called modifiable area unit (MAU) problem may create biases towards one set of data. Thus, before data integration, the internal heterogeneity of administrative units should be investigated and remedial measures should be considered.
3. Framework for Data Integration in Thailand
3.1 Data Collection and Database Building
With regional development issues in the focus, data in Chiang Mai - Lamphun and Pathum Thani areas, Thailand were collected from various government offices in the form of physio-graphic data (e.g., topographic, administrative, land-use, industrial locations as well as transportation network maps) and socio-economic indicators. Satellite data of different dates (1986, 1989, 1993, 1999 for Pathum Thani and 1986, 1994 for Chiang Mai - Lamphun areas) were used to provide up-to-date land cover and land use information. The image processing procedures were used to classify georeferenced remotely sensed images and to produce updated classified land-use maps and transportations networks maps in raster format (ERDAS Imagine). The detailed image processing procedures were discussed in Tran (1998). The spatial physio-graphic data sets from paper maps were classified, digitized and fed into vector GIS (Arc/Info). The classified images were, then, integrated with other environmental and societal data sets through raster-to-vector data conversion to update and build time series data. As the loose data integration approach was used in this research, data were managed in both raster and vector format and convert from one to another when data analysis required.
The major source for socio-economic data is the National Rural Development Database (NRD-2C), which provides surveyed data at village level after each two years from 1986 composing of more than 100 economic and social indicators. The data were also collected from other government documents, statistical records at provincial and municipal offices. They were selected, reclassified and combined based on the basic administrative unit IDs - village code number in dBase IV format. A program in Visual FoxPro was written to automate the process of extracting, normalizing and combining socio-economic indicators including population, income, education, health, natural environmental conditions, services, agriculture and industrial activities, work force, capital investment, employment, etc. (Tran, 1998).
3.2 Integrated GIS Database Management
As data management in GIS facilitates the integration of diverse data sets and determines the analyses possible with those data, some data transformation routines were built in this research to facilitate the conversion of physio-graphic and socio-economic data to a common spatial structure (e.g., set of areal units). The spatial physio-graphic data in GIS database were to summarize/regionalize by administrative units in order to be compatible with socio-economic data.
Modifiable area unit problem: To choose desirable aggregation units criteria on within-unit variance and spatial autocorrelation index were used. In the case of Chiang Mai - Lamphun area, two possible regionalizations on the basis of aggregated villages were examined for 1036 selected villages: by amphoe or by tambol. The internal variation in each of the spatial units (regions) was measured using the average coefficient of variation of test variable (village population density in 1994). The between regions variation was calculated as the coefficient of variation of all regional population values (Coefficient of Variation = Standard Deviation / Mean).
Table 1 Comparative study of variations for different variables on various levels of aggregation of population density in 1994 data.
| Regionalization Level | No. | Within-unitCoeff. of Variance | Between-unit Coeff. of Variance | Moran Coefficient |
| Villages Tambols (sub-district) Amphoes (district) |
1036 146 16 |
N / A 24.23 41.47 |
28.52 29.39 33.54 |
N / A 0.4441 0.7104 |
The results reported in Table 1 indicated that amphoes have higher within-regions rather than between-regions variation of population density and much higher Moran coefficient of autocorrelation as compared to tambols. This showed that the aggregation at amphoe level would increase the loss of spatial information, leaving the tambol level as the desirable level of aggregation (basic spatial unit) for data integration.
Compilation of socio-economic data: The socio-economic data were aggregated from village to tambol level, and were normalized as relative shares of the total population of each respective tambol, in order to further reduce the effect of unequal sizes of tambol.
Creating Spatial Indicators within GIS: The spatial physio-graphic data such as land use types, road networks, irrigation networks, industrial factories were aggregated to tambol level using spatial overlay and logical-statistical analysis functions in GIS (Arc/Info). Some accessibility measures such as distance from residential areas to nearest roads and nearest factories were derived through GIS spatial joins functions utilizing the locational information of data. The common summarizing/regionalizing procedures are presented in Figure 1.
Figure 1 GIS procedure to regionalize the spatial physio-graphic indicators into tambol level from Chiang Mai - Lamphun spatial database.
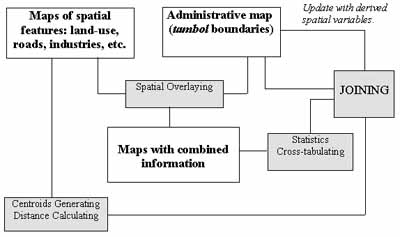
Comprehensive spatial GIS database: With all aggregated socio-economic data and regionalized spatial physio-graphic data to common tambol level, the GIS join function through a key item - tambol ID - was used to complete the spatial GIS databases for Chiang Mai - Lamphun and Pathum Thani areas. The GIS databases, thus, containing comprehensive spatial information characterizing development states of the Chiang Mai - Lamphun area (in 1986 and 1994) and Pathum Thani area (in 1979, 1989 and 1999) for each tambol in terms of:
- spatial physio-graphic data: % of urban land-use, industrial
land-use, agricultural land-use, road length density, irrigation length
density, median distance from industrial land to closest residential
areas, median distance from residential area to the nearest
road;
- demographic aspect: population density; economic aspect: average household property taxes, travel time to nearest town and commercial center, % of farmer, per capita number of vehicles, number of factories, per capita industrial capital investment, % factory employees, average household income, % people working far from home; and social aspect: level of primary education, secondary education, illiterate rate, etc.
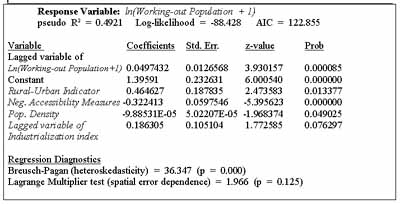
The resulting spatial data sets in unique format are useful for further empirical analysis of regional spatial development patterns using various multivariate statistical and spatial statistical analysis techniques. With these databases, policy makers can easily explore data and their spatial coincidences at locations of interest, visualize spatial patterns in economic, social and demographic aspects at times of interest, visualize time trend of regional development based on social / environmental indicators of interest, and create various tambol development index based on combined indicators for planning and management. On the other hand, with more sophisticated analysis and modeling tools, researchers could go further in analysis to gain insights into regional development problems. As an example to illustrate the utilization of the derived GIS databases, below is a spatial model of urban-rural interactions in Chiang Mai - Lamphun area, Thailand. As rural labor outflow (in form of % of Working-out Population variable) indicates job attraction of urban centers as well as the excess of free labor released from the agricultural sector, it could represent the intensity of urban-rural linkages, as a result of regional development. The spatial regression techniques were adopted to produce the final spatial-lag regression model of urban-rural interactions in Chiang Mai - Lamphun area in 1994 as shown in Table 2. It confirmed significant urban-rural disparity and important roles of industrial establishments and infrastructure development in regional labor migration in Chiang Mai - Lamphun area. The detailed modeling process and its interpretation are beyond the scope of this paper; they were discussed in Tran (1998). Some results in analyzing urban-rural interactions using the integrated GIS database in Pathum Thani area will be discussed in the presentation.
Table 2 Results of spatial-lag regression analysis to study the urban-rural interactions in Chiang Mai- Lamphun area in 1994.
4. Concluding Remarks
The paper has indicated that GIS is a useful technical tool in integrating social and environmental data for regional development studies in Thailand. With decentralization planning on increase in Thailand, these comprehensive GIS databases at tambol level could provide needed details to local decision makers at the newly-created administrative level - Tambol Administrative Organization (TAO). The results of these case studies showed that socioinformatics overcome the "data barriers" problem and can be successful in the developing world. Furthermore, with the developed spatial databases, GIS can serve as an efficient technical vehicle for spatial analysis and spatial modeling functions to gain insights into regional development problems, e.g., to evaluate development impacts in the past, and to enhance regional development strategies through facilitating various scenarios. Some theoretical issues on data integration, however, remain to be further addressed as an important area of future research. The data integration framework described in this paper can be also extended into various regional environmental impacts researches.
References
- Brown, D.G., 1996. Spatial statistics and GIS applied to internal
migration in Rwanda, Central Africa. In Arlinghaus S. L., Practical
Handbook of Spatial Statistics. New York: CRC Press Inc., pp. 149-173.
- Flowerdew, R., and Green, M. (1989). Statistical methods for
inference between incompatible zonal systems. In M.F. Goodchild and S.
Gopal, Accuracy of Spatial Databases. London: Taylor and Francis, pp.
239-247.
- Goodchild, M.F., Anselin, L., and Deichmann, U. 1993. A framework
for the areal interpolation of socioeconomic data. Environment and
Planning A, Vol. 25, pp. 383-397.
- Huxhold W.E., 1991. Introduction to Urban Geographic Information
Systems. New York: Oxford University Press Inc.
- Kliskey A.D., 1995. The role and functionality of GIS as a planning
tool in natural-resource management. Computer, Environment and Urban
Systems, vol. 19, No. 1, pp. 15-22.
- Klosterman R.E., 1995. The appropriateness of geographic information
systems for regional planning in the developing world. Computer,
Environment and Urban Systems, vol. 19, No. 1, pp. 1-13.
- Tobler, W. 1979. Smooth pycnophylactic interpolation for
geographical regions. Journal of the American Statistical Association,
Vol. 74(367), pp. 519-536.
- Tran H., 1998. Integrating GIS with spatial data analysis to study the development impacts of urbanisation and industrialisation: Case study of Chiang Mai - Lamphun area, Thailand. Ph.D. Dissertation No. SR-98-3, Asian Institute of Technology, Bangkok, Thailand.