| GISdevelopment.net ---> AARS ---> ACRS 2000 ---> GIS & Data Integration |
Application of GIS to Measure
and Evaluate Landscape Changes
Chi-Chuan CHENG (Taiwan)
Deputy Director, Taiwan Forestry Research Institute
53, Nanhai Road, Taipei 100, Taiwan
Telephone: +886-2-23039978 Facsimile: +886-2-23757469
E-mail: cccheng@serv.tfri.gov.tw
Jihn-Fa JAN (Taiwan)
Assistant Professor, Department of Geography
National Changhua University of Education
1, Jinn Der Road, Changhua 500, Taiwan
Telephone: +886-4-7232105 ext. 2825 Facsimile: +886-4-7211186
E-mail: jfjan@cc.ncue.edu.tw
Key words: GIS, landscape ecology, landscape diversity.
Abstract: This study used the 'Liukuei ecosystem management area' of the Taiwan Forestry Research Institute as the study area. Geographic information systems were used to integrate indices of landscape structures to investigate the effects of management activities on the landscape. Forest type maps of the area in 1988 and 1996 were derived using digital photogrammetry and GIS. To analyze the effects of cutting and forest road building on the landscape, indices of landscape structure referring to landscape composition and landscape configuration were calculated. The results show that cutting and forest road building increased the numbers and types of patches. They not only directly altered the variety and abundance of the patches, but also indirectly affected landscape structure properties such as landscape diversity, evenness, and interspersion and juxtaposition. Several indices were compared, and it was found that the Shannon diversity performed better in distinguishing landscape changes. In addition, the effects of cutting and forest road building on the landscape were not significant based on the t-test result of the Shannon diversity index. This study reveals that integration of GIS and quantitative indices of landscape structure is a feasible and efficient approach for evaluating the effects of management activities on landscape.
1. Introduction Landscape monitoring is a basis for studying forest landscape changes and validating theories of landscape ecology. Landscape ecology is a science that studies the relationships and mechanisms among landscape patches, i.e. a research focuses on the structure, function, and change of the landscape. However, to understand the function and change of the landscape, it is a prerequisite to quantify the landscape structure (O'Neill et al., 1988; Li, 1990; Turner, 1990; Turner and Gardner, 1991). Early studies on the quantification of landscape structure were mostly for special purpose or lack of analysis tools, thereby the results were limited (Turner, 1990). In recent years, the development of geographic information system (GIS) makes timely temporal and spatial information accessible. Moreover, its capability of spatial analysis and presentation makes it a useful tool for studying landscape spatial structure and landscape change analysis. Publications on the application of GIS in landscape research include: Burrough (1986), Cola (1989), Lam (1990), Rex and Malason (1990), and Olsen et al. (1993).
Integration of landscape ecology and GIS in landscape monitoring for forest management in Taiwan has become the main focus of researches recently. Wang (1998) and Cheng el al. (1999) used GIS and fractal dimension to monitor spatial variation of forest landscape. Huang (1997) used Shannon index to monitor landscape diversity. However, publication concerning application of landscape index to evaluate the effects of cutting and forest road building on landscape structure and landscape changes has not been seen. Therefore, this study used digital photogrammetric technique to produce 1/5000 scale forest type maps of the 'Liukuei ecosystem management area' in 1988 and 1996. The objective was to apply GIS and quantitative indices of landscape structure to investigate the effects of cutting and forest roads building on landscape changes in the study site.
2. Materials and Methods
2.1 Study area and materials
The 'Liukuei ecosystem management area' occupies about 2440 hectares. Approximately 75% of the area is covered with natural hardwood forest, whereas only a small portion of the area is plantation, within which Taiwania cryptomerioides is the most commonly planted species.
Two forest type maps (scale 1/5000) of 1988 and 1996 were produced using digital photogrammetric technique (as shown in Figure 1). A GIS database was established for quantitative analysis of the landscape structure. The software and hardware used in the study included a digital photogrammetric workstation, personal computers, ARC/INFO, ArcView GIS, and ERDAS IMAGINE.
2.2 Analysis methods
Quantification of landscape structure is a key element for studying landscape functions and changes. Therefore, this study applied GIS to calculate indices of the landscape structure using the forest type maps for 1988 and 1996, respectively. These indices were then used to analyze the landscape changes in the study area.
2.2.1 Quantification of landscape structure
A landscape can be characterized by its composition and configuration (Dunning et al., 1992). Landscape composition refers to the variety and abundance of patch types within a landscape. Landscape configuration refers to the placement or spatial character of patches within a landscape. These two aspects can independently or jointly affect the ecological processes. This study followed the approach proposed by McGarigal and Marks (1994) to quantify the landscape structure. Several quantitative indices were used to measure landscape composition and landscape configuration for analyzing the effects of landscape changes.
Three indices were used to characterize the landscape composition, that is, landscape diversity, patch richness, and landscape evenness. The landscape diversity is often represented by three indices, which include Shannon diversity index (SHDI), Simpson diversity index (SIDI), and modified Simpson diversity index (MSIDI). Patch richness (PR) is simply the number of patch types. The landscape evenness is further described by Shannon evenness index (SHEI), Simpson evenness index (SIEI), and modified Simpson evenness index (MSIEI). For landscape configuration, this study used the interspersion and juxtaposition index (IJI) to illustrate the distribution characteristics of the landscape patches. Detailed definitions of these indices can be referred to McGarigal and Marks (1994).
2.2.2 Monitoring of landscape changes
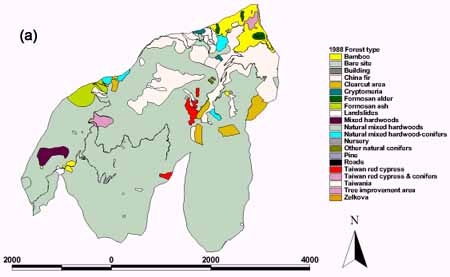
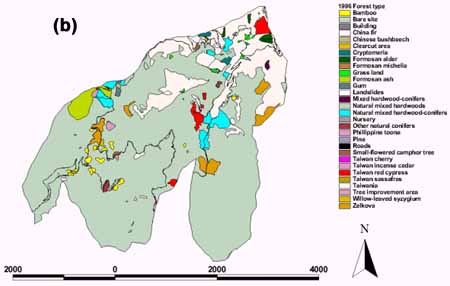
Figure 1. (a) Forest type map of 1988, (b) forest type map of 1996.
2.2.2.1 Analysis of landscape changes
Figure 1 illustrates the distribution of each forest type in1988 and 1996. The landscape is mostly composed of natural mixed hardwood forests, which can be regarded as the matrix of landscape. Resulting from human disturbances, plantations and forest roads can be treated as patches and corridors. From 1988 to 1996, it is apparent that management activities (e.g. plantations replanted after cutting and forest road building) were two major landscape changes. Therefore, this study used the aforementioned eight quantitative landscape structure indices to analyze the effects of cutting and forest road building on landscape changes.
2.2.2.2 Test of landscape changes
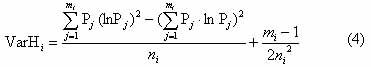
To understand the effects of cutting and forest road building on forest landscape changes, this study used the t-test method proposed by Magurran (1988) to examine the variation of landscape changes in the study area. This method was based on the Shannon diversity index. The equation of t-test is as follows:
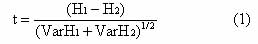
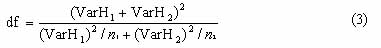
where Hi is the Shannon diversity index of landscape i or stage i, mi is the number of patch types, ni is the number of patches, and Pj refers to the percentage of either the number of patch type j to the total number of patches, or the area of patch type j to the total area. The latter definition of Pj was used in this study. Var Hi is the variance, and its equation and degree of freedom are as follows:
3. Results
The results of using GIS to quantify the landscape structure and eight quantitative indices to analyze the landscape changes were as Table 1. Table 1 depicts the quantitative indices of landscape structure derived from forest type maps of 1988 and 1996. The differences and the effects of cutting and forest road building on forest landscape of 1988 to 1996 were as follows:
- Cutting and forest road building resulted in increase of patch numbers (PN) from 104 to 249 and patch richness (PR) from 21 to 30.
- All the three landscape diversity indices (SHDI, SIDI, MSIDI) increased from 1988 to 1996, and SHDI had the largest increment among these three indices. The result reveals that the Shannon diversity index performed better in distinguishing landscape diversity.
- All the three evenness indices (SHEI, SIEI, MSIEI) decreased from 1988 to 1996, and SHEI had the largest decrement among these three indices. The result reveals that the patches within the landscape tended to distribute more unevenly after cutting and forest road building, but the difference was not significant.
- The interspersion and juxtaposition index (IJI), representing landscape configuration, decreased after cutting and forest road building. The difference in IJI is more prominent as compared to the indices of landscape diversity and landscape evenness. This reveals that the disturbance from cutting and forest road building resulted in more uneven distribution of adjacencies for the landscape configuration.
Table 1. Effects of cutting and forest
road building on forest landscape from 1988 to 1996. Index 1988 yr.
1996 yr. Difference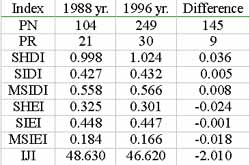 |
To examine whether cutting and forest road building caused significant effects on landscape changes or not, a statistical method was needed to test the extent of landscape changes. Table 2 was obtained using t-test of Shannon diversity index at a=0.05. The results indicate that cutting and forest road building from 1988 to 1996 did not cause significant landscape changes in the study area.
| t value | 0.222 |
| Degree of freedom | 204 |
| Test result | NS1) |
| 1)NS: not significant at 5% significant level. | |
4. Discussion
In this study, the forest type data obtained from 1988 and 1996 were used to quantify the landscape structure and to evaluate the effects of cutting and forest road building on landscape changes. The results were obtained based on: (1) the scale of forest type maps was 1/5000; (2) the maps were in vector format rather than raster format; (3) the Pj used for calculating landscape diversity and landscape evenness indices was defined as the percentage of the area of patch type j versus the total area. For different map scales, raster format maps, and defining Pi as the number of patches of type j versus total number of patches, the results need to be further studied and compared.
The quantitative indices of landscape composition can be used to analyze landscape changes. However, the landscape diversity indices had larger differences and more consistent results than the landscape evenness indices, and therefore are more suitable for landscape changes analysis. Among the three landscape diversity indices, the Shannon diversity index is most suitable for analysis.
The landscape structure indices including diversity indices, evenness indices, and interspersion and juxtaposition index were either slightly increased or decreased after cutting and forest road building. This implies that management activities can affect landscape changes. However, the t-test results of Shannon diversity indicate that effects of cutting and forest road building on landscape changes in the study area were not significant.
5. Conclusion
The study was concluded as follows:
- Application of GIS and quantitative indices of landscape structure in evaluating the effects of cutting and forest road building on landscape changes is a feasible and effective approach. This approach can be used for landscape planning and monitoring of the study area in the future.
- Management activities such as cutting and forest road building increased the numbers and types of patches. They not only directly altered the variety and abundance of the patches, but also indirectly affected the landscape structure properties such as landscape diversity, evenness, and interspersion and juxtaposition. Several indices were compared, and it was found that landscape diversity indices had larger differences and more consistent results, and therefore they were more suitable for landscape changes analysis. In addition, among the three landscape diversity indices, the Shannon diversity index performed better in distinguishing landscape changes.
- From the t-test results of Shannon diversity index, cutting and forest road building did not cause significant effects on landscape changes in the study area. Therefore, from landscape perspective, management activities of the study area did not incur significant effects on the forest landscape up until 1996.
- Burrough, P.A., 1986. Principles of Geographic Information System
for Earth Resources Assessment. Clarendon Press, Oxford, UK, 193 p.
- Cheng, C.C., J.F. Jan, and L.T. Hsu, 1999. Application of fractal
dimension in monitoring forest landscape structure and change. Taiwan
Journal of Forest Science, 14 (4), pp. 397-407 [in Chinese with English
summary].
- Cola, L.D., 1989. Fractal analysis of a classified Landsat scene.
Photogrammetric Engineering and Remote Sensing, 55 (5), pp. 601-610.
- Dunning, J.B., B.J. Danielson, and H.R. Pulliam, 1992. Ecological
processes that affect populations in complex landscape. Oikos, 65, pp.
169-175.
- Huang, C.C., 1997. Study on landscape monitoring of forest: an
illustration of Huisun Experimental Forest Station [dissertation].
National Chung-Hsing University, Taiwan, 161 p. [in Chinese with English
summary].
- Lam, NS-N., 1990. Description and measurement of Landsat TM image
using fractals. Photogrammetric Engineering and Remote Sensing, 56 (2),
pp. 187-195.
- Li, H., 1990. Spatio-temporal pattern analysis of managed forest
landscape: a simulation approach [dissertation]. Oregon State
University, Corvallis, 166 p.
- Magurran, A.E., 1988. Ecological diversity and its measurement.
Princeton University Press, Princeton, NJ, 179 p.
- McGarigal, K., and B.J. Marks, 1994. Spatial pattern analysis
program for quantifying landscape structure. Dolores (CO): P.O. Box 606.
67 p.
- Olsen, E.R., R.D. Ramsey, and D.S. Winn, 1993. A modified fractal
dimension as a measure of landscape diversity. Photogrammetric
Engineering and Remote Sensing, 59 (10), pp. 1517-1520.
- O'Neill, R.V., J.R. Krummel, R.H. Gardner, G. Sugihara, B. Jackson,
D.L. DeAngelis, B.T. Milne, M.G. Turner, B. Zygmunt, S.W. Christenser,
V.H. Dale, and R.L. Graham, 1988. Indices of landscape pattern.
Landscape Ecol 1, pp. 153-162.
- Rex, K.D., and G.P. Malason, 1990. The fractal shape of riparian
forest patches. Landscape Ecology, 4 (4), pp. 249-258.
- Turner, M.G., 1990. Spatial and temporal analysis of landscape
patterns. Landscape Ecol 4, pp. 21-30.
- Turner, M.G., and R.H. Gardner, 1991. Quantitative methods in
landscape ecology. Ecol Studies. Vol. 82. Springer-Verlag, New York, 536
p.
- Wang, S.F., 1998. Application of geographic information system and fractal dimension in forest landscape spatial variation monitoring. [MSc thesis]. National Taiwan University, Taiwan. 73 p. [in Chinese with English summary].