| GISdevelopment.net ---> AARS ---> ACRS 2000 ---> Forest Resources |
Application and Validation of
LWCI (Leaf Water Content Index) to Tropical Seasonal Forest
Region
Michio Anazawa*, Genya
Saito* and Haruo Sawada**
*National Institute of Agro-Envionmental Sciences
3-1-1 Kannondai, Tsukuba, Ibaraki 305-8604, JAPAN
Tel + 81-298-38-8192 Fax +81-298-38-8199
E-mail: http://www.gisdevelopment.net/aars/acrs/2000/ts6/mailto;anazawa@maes.affre.go.jp
**Forestry and Products Research Institure,
1 Matsunosatio, Kukisaki-machi, Ibaraki, 305-8687, JAPAN
Keywords: LECI,
Tropical Seasonal Forest, Environmental Gradient Analysis, LAI,
Precipitation *National Institute of Agro-Envionmental Sciences
3-1-1 Kannondai, Tsukuba, Ibaraki 305-8604, JAPAN
Tel + 81-298-38-8192 Fax +81-298-38-8199
E-mail: http://www.gisdevelopment.net/aars/acrs/2000/ts6/mailto;anazawa@maes.affre.go.jp
**Forestry and Products Research Institure,
1 Matsunosatio, Kukisaki-machi, Ibaraki, 305-8687, JAPAN
Abstract: Leaf Water Content Index derived from Landsat TM is found for detecting the leaf water content for tropical seasonal forest in Thailand. Water availability for detecting the leaf water content for tropical seasonal forest in Thailand. Water availability of plant leaves is recognized as the most important key for forming vegetation types in this forest zone, e.g. shedding of the leaves begins from the bottom of the mountain (which is contrary to that of temperate forest) and the gallery forest along water streams keep leaves all the year. Based on this index, water availability map, which shows the seasonal change of foliage moisture within vegetation area was created fro Kanchana Buri study site in western Thailand. The dominant forest types are dry-dipterocarp forests (DDF), mixed deciduous forest and bamboo forest. Seven Landsat TM data were used to estimate the leaf water contents at each time. Then, the time sequential analysis and filtering process (Modal filter) was applied to delineate the terrain on the basis of differences of water availability.
Integrating the DEM data, environmental gradient analysis was conduct to the water availability map for three watersheds, north side, west side and east side. The result shows that not so many deciduous forests are found even in low elevation at north side, deciduous trees are dominant in al elevation at west side and impact of human activities (agriculture) made up quite different vegetation types and land use at east side.
As for Landsat TM data, the correlation between LWCI and ground truth data at the Mae-Klong watershed research center (the meteorological data, etc.) could be analyzed. It was also found to have a tendency of close relation to precipitation and evaporation with the time lag of evaluating terrain condition and understanding the vegetation types which are found in tropical seasonal forest area.
1.Introduction
Seasonal change is one of the most important information for analyzing growing condition of vegetation and the NDVI derived from satellite remote sensing data is generally used for this purpose. The NDVI, however, is influenced by haze and smoke very much. Therefore, an index is required for monitoring tropical seasonal forest area where smokes caused by fires in agriculture land affect very often.
The change of water condition within forest such as the leaf water content according to seasonal alternation (water stress: wet and dry) seems to play important role in phonological dynamics of tropical monsoon forest, especially in deciduous forest and rain-green forest like teak. As for the monitoring of forest phenology and vegetation activities in this area, it is effective to measure the leaf water content by using remote sensing data. It seems possible to monitor the change of leaf water content by applying LWCI Index to TM processed in advance with radiometric rectification.
In this study, improving upon LWCI proposed by Raymond Hunt and et al, we contrived Mlwci(Modified_LWCI). Applying this index to every pixel, the zoning image was created, which shows the regional feature of the water supply condition in dry season.
We intended to develop the leaf water content index (LWCI) into the practical remote sensing index that can catch the water availability of leaves in tropical seasonal forest without receiving the influence of haze such as clouds and fog.
2. Study Area and Data Used
(1) Study area
North East f Kanchana Buri, Thailand.
UTM Coordinates (N 1602996 - N1630496, E73000 -E00500)
(2) Data used
(a) 7scenes of Landsat TM data in dry season from beginning to the end were selected. These data were obtained from NRCT and NASDA.. The following Table 1 shows acquisition data of Landsat TM.
| Area | Sensor | Path Row | Data |
| Kanchana Buri | Landsat TM | 130 - 50 | 1989/12/5,1990/4/17,1993/1/30,1993/4, 1994/4/17,1994/3/6,195/2/21(scenes) |
(b) DEM data (UTM) of the study site from the geographic map with the scale 1:50,000(derived from 100m contours, pixel size:30m).
(c) Meteorological data observed at Mae-Klong watershed research station (1993-1997).
3. Methodology and Analysis
(1) Definition of LWCI (Leaf Water content Index)
On the basis of LWCI proposed by Raymond Hunt (1987), we contrived new LWCI intended for practical use, so as to utilize the energy value of remote sensing data instead of measuring reflectance. The index TM4 and TM5 spectral bands in which the difference in water content of leaves appears conspicuously (Fig.1).
The formula of new LWCI is as follows,
A: Maximum value of TM4 through whole images
B: Maximum value of TM5 through whole image
a: a correction coefficient (usually 1).
b: the coefficient for converting the energy value into the reflectance(the reflectance value ratio at the season of the minimum water stress in a leaf = the ratio of TM5 in the theoretical solar radiation spectrum curve: the representative value : 0.2).
TH4ft & TM5ft: TM4 and TM5 at the season of the minimum water stress (full turgor), that is these are the maximum value composite image of TM4 derived from all image and the minimum value composite image of TM5 derived from all images.
- Here, instead of reflectance, the energy value (transformed from radiance according to sensor's dynamic range) is used for TM4, TM5, TM4ft and TM5ft, respectively.
- Creating of the multi-temporal LWCI Images
By applying LWCI to those geometrically corrected and radimetrically rectified images, 7 LWCI images were created (Fig.2).
- Creation of the multi-temporal LWCI Images
The seasonal change of LWCI and the meterological data of the Mae-Klong watershed research station were compared (Fig.3). The experimental plot data (LAI, Leaf Litter Production) of MWRS were compared with LWCI. Furthermore, GPS photos at the ground were compared with LWCI Image by using 3D perspective view images.
- Water Available Map in Kanchana Buri based on LWCI
The K-means clustering method was applied to the LWCI images to classify the pattern of the LWCI changes in this area. As the result, 21 cluster were identified. These 21 cluster were summarized into 10 categories which show different seasonal change patterns of the LWCI.
The difference of the seasonal changes of LWCI are caused by the water available and also by the vegetation types. Therefore, a filtering is needed to be applied to the clustering result to minimize the influence of the difference of vegetation types and to get the zoning map on water availability. (Fig.4).
- Environmental Gradient Analysis for three watersheds
The study area was topographically divided into three watersheds for analyzing the site characteristics by the environmental gradient analysis.
Integrating the DEM data, the environmental gradient analysis (Fig.6) was conducted to the water availability map for three watersheds, north side, and east side of the study area(Fig.5).
Result and Discussion
(1) Comparison of LWCI with other observed data.
In Comparison of the seasonal change of LWCI and the meteorological data of the Mae-Klong watershed research station, it seems that the changes of LWCI correspond to precipitation and evaporation with the time lag of 1-2 months(Fig.3). However, it's necessary to collect more data ranging long term (more than 2 years) for analyzing the detail correlation.
(2) Water Available Map and Environmental Gradient Analysis
The results (Fig.6) clearly show as follows,
- In the north side (where the watershed faces the north), the rate of evergreen trees and deciduous trees that do not shed the green leaves is the highest. This indicates that the water availability condition is the best at the north side.
- In the west side, the relation between the elevation and the rate of
evergreen is linear.
This indicates that the west side has the standard trend of the vegetation types according to the elevation. - Compared with the north side, it is found that the land use of the
west and the east sides are much more advanced (agricultural area,
irrigating water etc.).
In tropical seasonal forest zone, LWCI is useful index for zoning water availability of vegetation area and for analyzing the phonological dynamics dry season. However, in case of comparison among pixels, it is necessary to consider the crown density and other factors that related to leaf density.
- The LWCI enables us to examine the relation between the satellite data and the ground truth data owing to its characteristic of physical quantites.
- The TM channels used for LWCI calculation are channel 4 and 5, which are not susceptible to influences from the atmospheric noise. Therefore, LWCI is suitable for the comparison of seasonal fluctuation of vegetation condition.
- Regional water condition map can be create using multi-temporal LWCI images. This map may supply the approach to understand water environmental changes in the tropical monsoon forest such as defoliation, evapotranspiration so on that correspond to its phonological dynamics.
- Integrating various kinds of GIS data such as DEM and satellite LWCI image, it is possible to conduct environmental gradient analysis of a target area to get useful information about the landuse (e.g. vegetation type, planted species, etc.).
This work was performed on the subject of environmental change analysis with forest monitoring information by the cooperative system for supporting priority research of Japan Department and National Research Council of Thailand for collaboration and the data providing.
References
- Boyd, D.S.,Foody, G,M.,Curran,P.J.,Lucas,R.M.,and Honzak, M., 1996.An assessment of radiance in Landsat TM middle and thermal infrared wavebands for the detection of tropical forest regeneration. Int.J.Remote Sensing,17,pp.249-261.
- Raymond Hunt, Jr.E.,Barrett,N.R.Park,S.N.,1987.Measurement of Leaf Relative Water Content by Infrared Reflectance. Remote Sensing of Environment,22,pp.429-435.
- Inoure, Y.,1993.Non-destructive Estimation of Water Status of Intact Crop Leaves Based on Spectral Reflectance measurements, Jpn.j.Crop Sci.,62(3),pp.462-469.
- Sawada H.,H.Saito, Y. Hirata and G.Takao., 1995. Characteristics of seasonal changed of forest observed by satellites, Proceedings of the international workshop on "The Changes of Tropical Forest Ecosystems by EL Nino and Others". Pp-241-246.
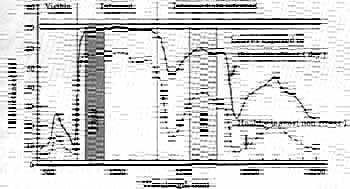
Fig.1 The spectral reflectance curve of the leaves exposed to the water stress and non stress.
---- RWC (Relative water content)=99.2%, -Rwc=12.2%
(Inoue,et al, 1993, material: peanut)
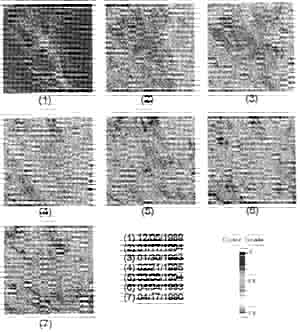
Fig.2 Seasonal Change Images of LWCI in Kanchana Buri
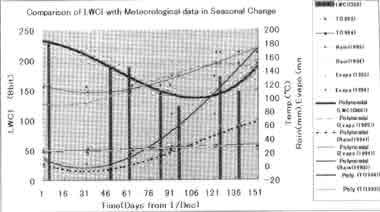
Fig.3 Comparison of LWCI with Meteorological Data in Seasonal Change
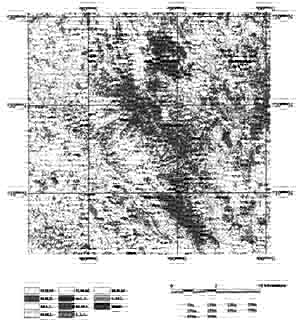
Legend: LWCI Change Pattern Class(e.g. H.M.L. means high LWCI value in the early, middle value in the middle, low value in the last stage)
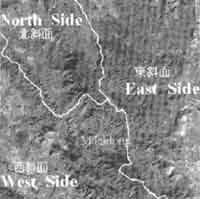
Fig.5 The Study Area is geographically divided into 3 Watersheds
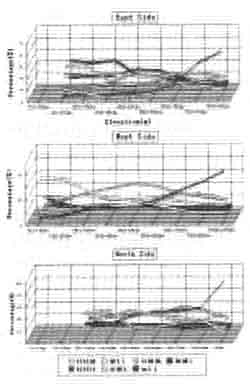
Fig.6 Correlation between Water Availability Classes and Elevation at the 3 Watersheds