| GISdevelopment.net ---> AARS ---> ACRS 2000 ---> Forest Resources |
Analysis of Fragmentation and
Anthropogenic Disturbances in the Himalayan Forests: Use of Remote Sensing
and GIS
Subrat Sharma, L.M.S. Palni
G.B. Pant Institute of Himalayan Environment & Development
Kosi-Katarmal, Almora 263 643, India
Fax: + 91 - 5962 - 31360; Email: prasad@nde.vsnl.net.in
P.S. Roy
Indian Institute of Remote Sensing
4, Kalidas Road, Dehradun 248 001, India
Fax: +91 - 135 - 741987; Email: psroy@del2.vsnl.net.in
Key WordsG.B. Pant Institute of Himalayan Environment & Development
Kosi-Katarmal, Almora 263 643, India
Fax: + 91 - 5962 - 31360; Email: prasad@nde.vsnl.net.in
P.S. Roy
Indian Institute of Remote Sensing
4, Kalidas Road, Dehradun 248 001, India
Fax: +91 - 135 - 741987; Email: psroy@del2.vsnl.net.in
District Almora, Forest, Fragmentation, Himalaya
Abstract
The vastness and rugged "difficult to reach" nature of Himalayan terrain poses serious limitations on field observations; consequently field experimentation and information collection to develop regional planning is often difficult. Satellite remote sensing and GIS can be utilized to extract information through simple analyses and/or by the use of models to answer specific questions. Only limited attempts have been made to use these technologies in describing landscape dynamics for biodiversity management in the Himalaya. In the present approach forest vegetation has been explored using IRS 1C -LISS III FCC in an area of ~3167.5 km2 (entire Almora district) and various landscape elements have been analysed. Forested area accounted for 42.2% of the total area. Most common vegetation type was pine forest (Pinus roxburghii), occupying 85.3% of the total forested area, but it was highly fragmentary in nature. Total 414 pine forest fragments were recorded over the entire landscape. Area of each patch varied from < 1 km2 to 179 km2; however, majority of fragments (77% of the total) were below 1 km2. These smaller units are possible sites of pine forest "extinction" due to anthropogenic pressures. A greater shape index (1.1 - 9.2) was observed for pine forest fragments. Edge effect analysis of the pine forest fragments indicated that the impact area ranged from 19.9 ha to 855.7 ha. These areas are subject to microhabitat alterations without canopy cover loss. Human dependency on natural vegetation appeared to be the main cause of fragmentation. Disturbance index model revealed that about 34% of the total landscape area is under severe anthropogenic pressure as apparent from high index. RS & GIS based landscape approach is an emerging tool for identification of hot spots for biodiversity conservation in the mountains, and especially to appropriately include human dimension in the management planning.
1. Introduction
Mountain environment is characterized by its complexity. Large variations in climate, water characteristics, soil, and geology have, over millenia, produced a wealth of biological diversity in flora, fauna and microbes. The Himalaya are massive mountains that occupy over 1 million km2. They produce a distinctive climate of their own and also influence the climate of much of the Asia. The Himalayan range contains some of the most spectacular biodiversity on earth, but much of it is under-explored and lacking in effective protection. The vastness and rugged "difficult to reach" nature of Himalayan terrain poses serious limitations on field observations; consequently field experimentation and information collection to develop regional planning is often difficult. There is a wide spread agreement that global biodiversity is being reduced at an accelerated rate (Myers, 1980) and current approaches to understand the landscape ecology are highly diverse. Landscape harbors all grades of biological hierarchy, from ecosystem level to species and genes, that are targeted for biodiversity inventories and conservation (Noss & Harris, 1986). Landscape may also include agricultural, forested, protected and ecologically sensitive areas, which interact considerably (Forman & Godron, 1986), and upon which humans have a major influence (Naveh & Lieberman, 1990). Remote sensing can be used successfully to identify the frequency, boundaries, sizes and shapes of various landscape components (Scott et al., 1993). Use of satellite remote sensing in vegetation related studies was introduced around mid eighties in the Central Himalayan region (Singh et al., 1985, Tiwari et. al., 1985). The technology was used to identify landscape/landuse patterns (Singh et. al., 1984), and approaches were developed for mapping, monitoring & change detection (Rathore et al., 1997, Sahai & Kimothi, 1994). Only limited attempts have been made so far to use satellite remote sensing & GIS in describing landscape dynamics and for biodiversity management. Using such an approach Dinerstein (1998) has recently assessed the biological importance and status of habitats & ecosystems of the Himalaya to identify gaps in conservation and protection, and a total of 16 Himalayan ecoregions have been identified. Literature review indicates paucity on printed information on the loss of Himalayan biodiversity, related issues, and landscape studies on fragmentation. In this rational the present effort is to explore the vegetation status (major forest types) and the role of human habitation in a mountain landscape of the Indian Central Himalayan region with particular reference to landscape attributes and fragmentation in respect of a predominant pine (Pinus roxburghii) vegetation in the middle Himalaya.
Study Area
The study area, District Almora, lies between 29o23'-30o00' N and 79o00'-80o05' E in the Indian Central Himalayan region (Fig. 1) and is one of the 13 hill districts of Uttaranchal State. Geographical extents of the district are spread in an area of about 3167 km2, and majority of landscape geologically falls in the Lesser Himalayan belt, however, administrative boundaries also extend to Siwaliks (0.2 %) in the southwestern part. The district is inhabited by 836 thousands persons (1991 Census) with a population density of 282.9 persons per km2.
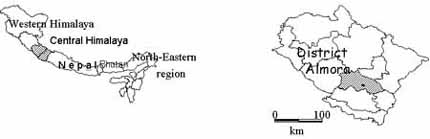
Figure 1. Location of Indian Central Himalayan region and district Almora.
Methods
Attributes of any broad vegetation type that is structurally homogenous and distinct such as a forest or grassland, are readily inventoried with remote sensing. Using maps and remotely sensed data, with verification from careful ground truthing, it is possible to draw limits around vegetation types (Roy et al., 1985). IRS-1C, LISS-III false colour composite (FCC) of bands 2, 3 & 4 of January 1998 was used to identify various forest types and landuse/landcover classes. Visual interpretation (interpretation key is given in Table 1) was done followed by ground truthing, and interpreted details were transferred to the base map. Forest, Landuse/ Landcover and other thematic maps were digitized and different vector data layers were created in PC ARC/INFO environment. Base map at 1:250,000 scale was prepared from Survey of India toposheet and information on settlements & primary road network was extracted from the same map. Road network was updated through a recent Survey of India map. Vector data layers were converted to raster data format with a cell size of 25x25 m (a pixel size class close to the spatial resolution of IRS-1C, LISS-III, i.e., 23.5 m) for the use of landscape analysis. Anthropogenic disturbances were measured as disturbance index (Anon., 1999) using a customised software (developed by I.I.R.S, Dehradun, India) and was computed by adopting a probabilistic weightage based linear combination of the landscape attributes.
| Vegetation | Tone/Colour | Texture | Physiography | Phenology |
| Riverine | Medium Grey | Smooth | Island type or near to river, Lowest elevations | Deciduous |
| Sal | Dull Red | Smooth | Lower elevation | Green leaves |
| Pine | Dark Brown | Smooth | Middle elevation | Green Leaves |
| Oak | Brick Red | Smooth | Higher elevation | Green Leaves |
| Oak mixed Conifer | Red with Brown tinge | Uneven | Highest elevation | Green Leaves |
Shape index (Patton, 1975) was calculated for various forest fragments. Shape index (SI) includes perimeter analysis for each land unit (polygon) to find out edge interaction. A common feature of fragmentation is a sharp increase in the amount of induced habitat edge. The SI describes the deviation of each fragment from circularity (a perfectly circular fragment will have a SI value of 1.0 whereas all other shapes have higher values). SI was calculated using the formula: SI = P/200 [(pTA)0.5] where TA = total area of the fragment (ha), and P = perimeter length (m). The area affected (due to edge impact) was computed (Laurance & Yensen, 1991) using equation:
Where AA adj = adjusted affected area of fragment, AA = computed affected area of fragment, TA = total area of fragment, SI = Shape Index of fragment. Remaining core area was calculated by the subtraction of affected area from the total area of fragment.
Results & Discussion
The forested area in the district Almora accounted for about 42% (1335.97 km2) of the total area. An elevational difference between ~500m and > 2500m amsl in the mountainous landscape of district Almora has produced a diversity in forest vegetation (Table 2); however, majority of the landscape falls in the altitudinal zone (~1000-1800m) favourable for pine (Pinus roxburghii) dominance in the Central Himalayan region. It is apparent from the spatial distribution of different major forest types (Fig. 2) and area occupied by each type (Table 2) that pine dominated forests are preponderant in the entire landscape of the study area. Pine dominated forest accounts for about 85% (representing 1140.1 km2) of the total forest while other forest types account for about 11% and 3.5% in case of oak (Quercus spp.) and sal (Shorea robusta) dominated vegetation, respectively. Riverine type in the lowest altitudinal range and oak-conifer type towards the highest altitudinal range are poorly represented on the district landscape.
While there is preponderance of pine forest, occurrence is very fragmentary in nature. A total of 414 forest patches of pine vegetation could be observed in the landscape (Table 3). The area occupied by each fragment varied between <1 km2 and 179 km2. The most noticeable feature is that 9% of the area occupied by pine vegetation is fragmented into a very large number (318, accounting for about 77% of the total number of pine patches). The addition of further 67 patches (area between 1-4 km2) the total area under this category enhances to 17%. This area analyses indicate that the vegetation fragmentation has reached an alarming stage because these small landunits are subject to further degradation and appear to be the possible sites of pine extinction. Smaller units are greater in number as reflected by the fact that fragments having area less than 4 km2, account for ~ 91% of the total number of fragments. The area covered by these fragments represents ~ 17% of the total area under pine forest. Highly fragmented appearance of pine vegetation is mainly due to the diffused nature of human settlements throughout the landscape. Villagers consume vegetation as firewood and fodder (Singh et. al., 1984, Sharma & Singh, 1994). Functioning of a village ecosystem reveals that firewood accounts for almost hundred per cent of the cooking energy in the domestic sector, and village ecosystem imports about 16 units of energy from the forest to support one unit of agronomic production. To support agronomic production from 1 ha of cropland net primary production of 1 ha of good stocked forest is needed (Sharma & Singh, 1994).
| Forest Type | Area (km2) | % of the Forest | Major Tree Species |
| Riverine | 3.49 | 0.3 | Acacia catechu, Dalbergia sisso |
| Sal dominated | 46.54 | 3.5 | Shorea robusta, Mallotus philippensis, Ehretia laevis, Adina cordifolia, |
| Pine dominated | 1140.10 | 85.3 | Pinus roxburghii, Pyrus pashia, Engelhardtia spicata, Myrica esculanta |
| Oak dominated | 142.82 | 10.7 | Quercus leucotrichophora, Quercus floribunda, Rhododendron arboreum, Lyonia ovalifolia |
| Oak & Conifers | 3.02 | 0.2 | Quercus semicarpifolia, Cupressus torulosa, Quercus floribunda, Rhododendron arboreum, |
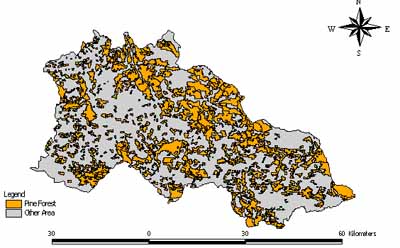
Figure 2: Spatial distribution of pine (Pinus roxburghii) forests in the district Almora.
The shape index among the various fragments ranged from 1.1 to 9.2. In general, it was observed that the smaller (in area) units had a low shape index than the larger units. For example, the smallest patches (having area < 1km2) had a shape index close to one (ideal shape being circular), i.e., 1.1 - 2.2, while the largest vegetation patches had a high shape index (7.7 - 9.2). A high shape index indicates micro-environment interaction at the edge of a vegetation patch. The edge interaction analysis, upto10 m inside from the edge of a patch, indicated that among the various size classes area affected by the edge impact ranged between 2.3% to 8.5% of the total area. In total 3793.86 ha area (3.3%) of the pine vegetation was found to be subjected to alterations in micro-environment due to exposed edges. Severity of edge impact was greater in the patches of smaller size class than the patches of larger size class; however, shape deviation from circularity was much more in the latter in comparison to the former. However, unaffected area from the edge impact accounted for 96.7% of the total pine vegetation. Statistics of the disturbance index model revealed that only about 228 km2 area on the entire landscape of the district was subject to no disturbance due to anthropogenic activities. At the district landscape 1299 km2 area can be categorized as being highly disturbed, 1077 km2 area as moderately disturbed, and ~560 km2 area had a low disturbance due to anthropogenic reasons. Forests of the Central Himalayan region have been subjected to exploitation throughout the history. Anthropogenically induced disturbances greatly impact the regeneration and status of forests (Upreti et. al., 1984). Anthropogenic disturbances are reflected in the decline of the tree stocking density, e.g., between 1973 and 1989 forests having good crown cover(>60%) declined annually at a rate of 27.8 ha shrinking to the total of 292 ha from 736.32 ha in a watershed of Gaula river (Rathore et al. 1997).
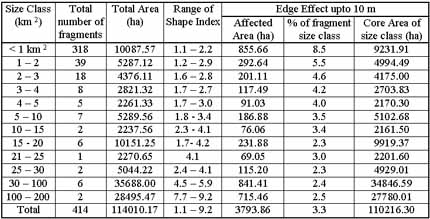
Table 3: Landscape attributes of pine forest fragments in district Almora.
Conclusion
Pine (Pinus roxburghii) showed extensive presence on the entire region of the district Almora due to various reasons which may vary from favourable climate, ecology (colonizer due to early successional nature of species), abiotic (landslides) to biotic (preference for this species by the state forest department for revenue generation). However, this species had a diffused presence throughout the landscape it was found to be more fragmentary in areas having high concentration of human settlements. RS & GIS based landscape approach is an emerging tool for identification and conservation of biological hot spots. This has been illustrated in the present study particularly in view of the fragmented nature of vegetation in the mountains and with reference to appropriate inclusion of human dimension in the management planning.
Acknowledgement
SS is thankful to Prof. B.L. Deekshatulu, Director, CSSTE-AP, India for providing opportunity. This work forms a part of the project carried out for M.Tech. Degree Course at CSSTE-AP, sponsored by ICIMOD, Kathmandu, Nepal.
References
- Anonymous, 1999. Project Manual for National Biodiversity Prioritization Programme. Indian Institute of Remote Sensing, Dehradun, India.
- Dinerstein, E., 1998. A Biodiversity Assessment and Gap Analysis of the Himalayas. In: Proceedings of Ecoregional Co-operation for Biodiversity Conservation in the Himalaya. UNDP Publication, New York, USA, pp. 157-161.
- Forman, R.T.T. & Godron, M., 1986. Landscape Ecology. John Wiley, New York.
- Laurance, W.F. & Yensen, E., 1991. Predicting the impacts of edge effects in fragmented habitats. Biological Conservation, 55, pp. 77 - 92.
- Myers, N., 1980. The problem of disappearing species: What can be done? AMBIO, 9(5), pp. 229-235.
- Naveh, Z. & Lieberman, A.S., 1990. Landscape Ecology: theory and Applications. Springer-Verlag, New York.
- Noss, R.F. & Harris, L.D. 1986. Nodes, networks and MUMs: Preserving diversity ata ll scales. Environmental Management, 10, pp. 299-309.
- Patton, D.R. 1975. A diversity index for quantifying habitat edge. Wildl. Soc. Bull., 3, pp. 171-173.
- Rathore, S.K.S., Singh, S.P., Singh, J.S., and Tiwari, A.K., 1997. Changes in forest cover in a Central Himalayan catchment: Inadequacy of assessment based on forest area alone. Journal of Environmental Management, 49, pp. 265-276.
- Roy, P.S., Dutt, C.B.S., Jadhav, R.N., Ranganath, B.K., Murthy, M.S.R., Gharai, B., Lakshmi, V.U., Kandya, A.K., and Thakker, P.S., 1996. IRS-IC data utilization for forestry applications. Current Science, 70(7), pp. 606-613.
- Sahai, B., and Kimothi, M.M., 1994. Remote Sensing of Nanda Devi Biosphere Reserve for biodiversity conservation. Proceedings of Seminar on Biodiversity Conservation, WWF, India. pp. 131-137.
- Scott, J.M., Davis, F., Csuti, B., Noss, R., Butterfield, B., Groves, C., Anderson, J., Caicco, S., D'Erchia, F., Edwards, T.C., Ulliman, J. & Wright, R.G., 1993. Gap analysis: A geographical appraoch for protection of Biological Diversity. Wildlife Monograph, 123, pp. 1- 41.
- Sharma, S., and Singh, S.P., 1994. Energy use pattern and sustainable development: A case study in rural landscape of the Central Himalaya. Landscape and Urban Planning, 29, pp. 19-24.
- Singh, J.S., Tiwari, A.K., and Saxena A.K., 1985. Himalayan forests: A net source of carbon for Atmosphere. Environmental Conservation, 12, pp. 67-69.
- Singh, J.S., Pandey, U. and Tiwari, A.K., 1984. Man and Forests: A Central Himalayan Case Study. AMBIO, 13, pp. 80-87.
- Tiwari, A.K., Saxena, A.K., and Singh, J.S., 1985. Inventory of forest biomass for Indian Central Himalaya. In: Environmental Regeneration in Himalaya: Concepts and Strategies, edited by Singh, J.S., Gyanodaya Prakashan, Nainital, India, pp. 236-247
- Upreti, N., Tewari, J.C. and Singh, S.P., 1985. The oak forest of the Kumaun Himalaya (India): Composition, diversity, and regeneration. Mountain Research & Development, 5(2), pp. 163-174.