| GISdevelopment.net ---> AARS ---> ACRS 2000 ---> Forest Resources |
Study on the Relationship
among the Machilus Spectral Behavior and Light Intensity and Physiological
Activity
Chinsu Lin
Assistant Professor, Department of Forestry
National Chiayi University
300 University Road, Chiayi (600)
Tel: (886)-5-2717476 Fax: (886)-5-2717467
Email: Chinsu@mail.ncyu.edu.tw
TAIWAN
Key WordsAssistant Professor, Department of Forestry
National Chiayi University
300 University Road, Chiayi (600)
Tel: (886)-5-2717476 Fax: (886)-5-2717467
Email: Chinsu@mail.ncyu.edu.tw
TAIWAN
Spectral Behavior, Light Intensity, Photosynthetic Rate, Machilus zuihoensis var. zuihoensis, Remote Sensing
Abstract
Spectral reflectance characteristic of plants was determined by many factors, such as leaf structure, pigment concentration, canopy structure, biomass, sunlight, atmospheric conditions, and so on. Among which plant parameters should be the most important bases for vegetative detection or monitoring senses. In this paper, one hardwood species, Machilus zuihoensis var. zuihoensis was selected to be research material. Reflected hemisphere irradiance was measured from five samples. Photosynthetic rate and light intensity were also measured in the same time of irradiance measurement. This study focuses to understand the relationship among the spectral behavior and light intensity and physiological activity, especially the photosynthesis. Spectral behavior for different wavelength was also analyzed. The results are considered to be benefit for natural resources monitoring or detecting by remote sensing.
1. Introduction
Multi-spectral data have been applied in natural resources researches for more than 20 years whereas their classification accuracy, in general cases, are not very high enough to satisfy the needs for planning the environmental and natural resources management. Especially for the cases of range area, spectral characteristics of vegetation become more sophisticated due to the terrain effect and vegetative variations, such as changeable crown density and its structure, and mixed trees in stand in a pixel, and so on. The spectral band width limitation of multi-spectral data now is overcome. Hyperspectral data that have very narrowed spectral intervals and coded as 2 bytes digital number, give us the chance for understanding the spectral behavior of targets. Vegetation, the living organism, may reflect the incident radiation according to their physical and physiological properties and hence it is more difficult to know how is the interaction between the light and vegetation in view of reflectance or reflected radiance - the major senses of remote sensing.
The process of plant uptake carbon dioxide from the air and water from the soil to produce nutrients for its growing is so call as photosynthesis and is one of the most important physiological activities of plant. This process takes place only in the existence of light. The reflected radiance of a plant is therefore related with the light intensity and photosynthetic rate and the organization of plant canopy, a group of branches and leaves. To understanding the interaction between the light and leaf physiological process, a tree named as Machilus was selected for measuring the reflected radiance from its leaf. Light intensity and photosynthetic rate are also measured in the same time of radiance measurement. In the mean while the concentration of chlorophyll is also analyzed in the laboratory.
2. Materials and Methods
2.1 Materials and Instrument Description
Both Lauraceae and Fagaceae plants are the most important and dominant vegetation for the middle elevation mountainous area in Taiwan. Machilus zuihoensis var. zuihoensis, a Lauraceae plant is one of the governmental assigned reforestation plants and hence several two-year old potted Machilus seedlings were selected as the study material. A portable spectroradiometer, LI-1800, is applied to obtain spectral radiation data of the plant. Figure 1 shows the LI-1800 optional diagram. The cosine receptor is designed to collect the radiant flux according to the cosine of the incident angle based on the Lambert's cosine law and accept radiation from all angles of a hemisphere. Therefore the LI-1800 measures the irradiance (watts.m-2.nm-1) under such consideration and is the case applied in this study. It also can be set to recording data in radiance (watts. m-2.nm-1.sr-1).
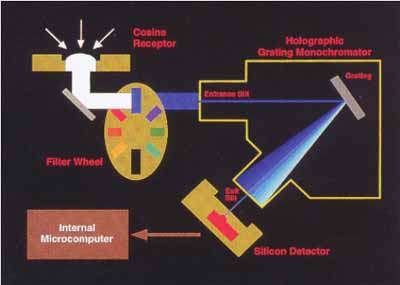
Figure 1. Operational diagram of LI-1800 spectroradiometer (adopted from LI-COR, 1989).
2.2 Configuration of Irradiance Measurement
For purifying the circumstances of reflected radiance measurements of vegetation, the remote cosine receptor and the LI-1800 is connected by a fiber probe and is settle to beneath the Machilus leaf to avoid the noises influence from canopy structure and background. Figure 2 depicts such configuration of the irradiance measurements. Because the measurements are made under plant canopies, it is therefore that what the machine recorded is irradiance and hence could reflect the leaf reflected irradiance amount. This study also adopted an accurate cosine correction for each measurement to avoid a significant error occurrence, that is dividing the cosine receptor scanned irradiance data (watts.m-2.nm-1) file by the instrument internal COSC file (LI-COR, 1989). Both photosynthetic photon flux density (PPDF) and illuminance (lux) is also calculated in each scan of leaf reflected irradiance. The value of PPDF and illuminance is then used for representing the photosynthetic rate of leaf and the light intensity from the hemisphere.
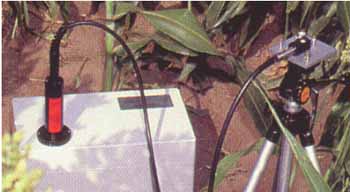
Figure 2. Configuration of leaf reflected irradiance measurement (adopted form LI-COR, 1989)
3. Result
3.1 Relationship between Photosynthetic Rate and Light Intensity
Relationship between leaf photosynthetic rate (Pn rate) and incident light intensity (Lux) was examined by regression method. The Pn rate could be more precisely estimated by light intensity in a parabolic regression equation in view of the determination coefficient (R2) of the regression line showed in figure 3a (left plot). More robust relations of those two variables could be achieved by standardization method. Figure 3b (right plot) depicts such stronger relationship of both standardized Pn rate and light intensity. R2 of the linear and the 2 orders polynomial equation is 0.8025 and 0.9225, which is large than the equations build from the original variables about 12 percent and 7 percent. Most important logically meaning of the standardized Pn rate and standardized light intensity relationship is that the polynomial regression line describes leaf Pn rate is increasing positively with the light intensity until the light intensity approaching a critical value where only little marginal effect of photosynthesis will happen. This is evident from the solid curvature line of figure 3b and is agree with the cases of Kramer and Kozlowski (1979).
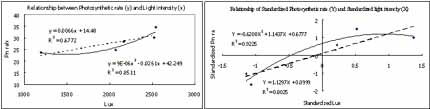
Figure 3. Relationships between the photosynthetic rate (Pn) of Machilus leaf and hemisphere light intensity (Lux). Left plot (a) and right plot (b) shows the fitted regression lines derived from the original variables, Pn and Lux, and their standardized variables.
3.2 Spectral Behavior of Machilus Leaf
The reflected irradiance (watts.m-2.nm-1) of Machilus leaf starting from 300 nm and ending at 1100 nm is recorded by a wavelength (l ) interval of 2 nm and is depicted in figure 4. Patterns of the reflected irradiance (RI) curves (peak-and-valley) around the wavelength of the five samples are almost identical to the ones of a healthy green leaf or vegetation (Lillesand and Kiefer, 1994) and also conform to the spectral irradiance pattern of reflected radiation (LI-COR, 1982).
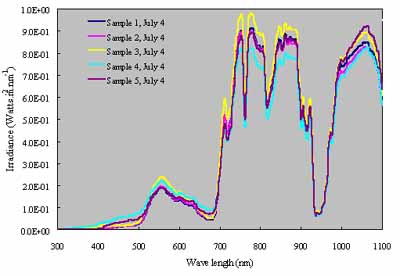
Figure 4. Reflected spectral irradiance curves of Machilus green leaves.
In briefly, leaf pigments absorb most of the incident blue (l £ 500 nm) and red (600 nm £ l < 700 nm) energy that are known as the photon flux density for photosynthesis (Kramer and Kozlowski, 1979). Significant RI Peak in the green is of course results from the color of leaf. The leaf RI increases dramatically in the infrared region (700 nm £ l ). One noticeable phenomenon of RI curves is that there are several valley happened in the infrared region. Dips in RI curve occur at 760, 820, 900, 914, 940, and 1100 nm is not appeared in the reflectance curve of healthy vegetation (Lillesand and Kiefer, 1992).
3.3 Relationship among the Leaf Reflected Irradiance and Light Intensity and Photosynthetic Rate
Theoretically the squared correlation coefficient (r2) of any two variables is identical to the coefficient of determination (R2) of a simple linear regression equation fitted by those two variables (Eq. 1). This study therefore applied the correlation analysis method to examine if the leaf-reflected irradiance of a particular wavelength is correlated with light intensity and photosynthetic rate. A Student's t test is then used to examine if the correlation coefficient of these two variables is statistically significant under 5% significance level. The results also could be the evidence of what will the leaf-reflected irradiance depend on the wavelength variation.
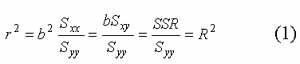
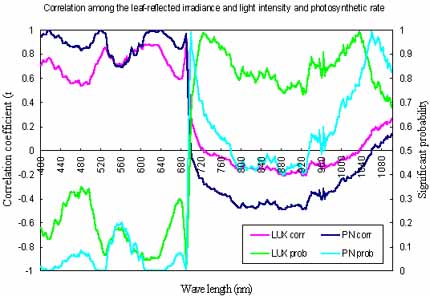
Figure 5. Relationship of the reflected irradiance and light intensity and that of the reflected irradiance and photosynthetic rate.
The correlation coefficient and its correspondingly significant probability of the leaf-reflected irradiance and light intensity (LUXcorr and LUXprob), and that ones of the leaf-reflected irradiance and photosynthetic rate (PNcorr and PNprob) for each wavebands are shown in figure 5. An interesting trend of these two correlation coefficient curves shows that a positive correlation exists in the visible area whereas a negative correlation exists in the infrared area. But the negative relationship should not be real for both case of light intensity and photosynthetic rate. Only the reflected irradiance in the range of 690-692 and 606-636 nm is significant correlated with light intensity and their correlation coefficient is about 0.90 and 0.85 respectively. While there are much of wavelength ranges (400-444, 500-532, 606-666, and 688-690 nm) whose reflected irradiance are significant correlated with photosynthetic rate and their correlation coefficients are correspondingly greater than 0.90.
4. Discussion
The study results showed that leaf-reflected irradiance is significantly correlated with photosynthetic rate in partial wavelength intervals of blue, green, and red bands; and is also significantly correlated with light intensity in a relatively narrow bandwidth of red band. They both have showed the 690 nm band is a common position where the correlation between the leaf-reflected irradiance and light intensity and photosynthetic rate are statistically significant. Since the 690 nm band is located at the edge of visible and infrared bands, it could maybe widely used for vegetation researches with remote sensing techniques.
Another important result of this study is that the light intensity is not linearly correlated with leaf-reflected irradiance. This maybe give us a hint of that leaf-reflected irradiance is somewhat independent with light intensity but it should be well examined by additional new measurement or experiment to test if it will be same for the case of leaf radiance or reflectance. In the future we will also focus on studies to understand if there is a nonlinear relationship exist between the light intensity and leaf-reflected irradiance.
5. References
- Kramer, P. J. and T. T. Kozlowski. 1979. Physiology of Woody Plants. NY: Academic Press. 811pp.
- LI-COR Inc. 1989. LI-1800 Portable Spectroradiometer Instruction Manual. Publication No. 8210-0030. Nebraska USA.
- LI-COR Inc. 1982. Radiation Measurements and Instrumentation. Publication No. 8208-LM. Nebraska USA.
- Lillesand T.M. and R.W. Kiefer. 1994. Remote Sensing and Image Interpretation. NY: John Wiley & Sons, USA.