| GISdevelopment.net ---> AARS ---> ACRS 2000 ---> Forest Resources |
Forest Fire Monitoring with
SPOT-4 Satellite Imagery
Kim Hwa LIM, Leong Keong
KWOH, Soo Chin LIEW and Hock LIM
Centre for Remote Imaging, Sensing & Processing, National University of Singapore
Lower Kent Ridge Road, Singapore 119260
Tel: (65) - 874 4411, Fax: (65) - 775 7717,
Email: crslimkh@nus.edu.sg
Key WordsCentre for Remote Imaging, Sensing & Processing, National University of Singapore
Lower Kent Ridge Road, Singapore 119260
Tel: (65) - 874 4411, Fax: (65) - 775 7717,
Email: crslimkh@nus.edu.sg
Forest Fire, SPOT-4, Calibration and Temperature
Abstract
This paper assesses the advantages of using SPOT-4 in forest fire monitoring. During the active fire period of 4-16 July 2000, many fires were detected in Sumatra, Indonesia. We found that the SPOT-4 432 representation (i.e., SWIR(4), NIR(3), and Red(2) bands in RGB display channels respectively) is especially effective for fire detection as active fire shows up distinctively as bright red patches and smoke plumes appear in faint bluish colour. However, in the usual 321 representation for SPOT-1 and SPOT-2 (i.e., NIR(3), Red(2), and Green(1) bands in RGB display channels), fire can only be detected from its smoke plume. One disadvantage of the SPOT-4 432 representation is that the smoke plumes tend to be too thin for the purpose of determining the size of the plumes. Thus, we propose a new way of displaying the SPOT-4 images. This is achieved by replacing the NIR band by the average of NIR and Green bands in the 432 representation. With this new representation, both the active fires and smoke plumes are clearly visible. Attempts have also been made to estimate the temperature of the active fires from the radiance detected in the SWIR band.
1. Introduction
Since the 1997/98 forest fire episode in South East Asia, the Centre for Remote Imaging, Sensing and Processing (CRISP) has carried out daily forest fire monitoring using SPOT imagery. The high resolution SPOT images were used to detect individual fires and to determine their nature in terms of the size of the smoke plumes, their locations and the landcover of the affected area. With SPOT-1 and SPOT-2 satellites, any given location in the Southeast Asia region can be observed with a repeat interval of two to three days. Ever since CRISP started acquiring SPOT-4 data in late 1999, together with SPOT-1 and SPOT-2, daily coverage of any given location in the region was made possible.
In this paper, we begin by assessing the advantages of using SPOT-4 in forest fire monitoring. The SWIR band of SPOT-4 is highly sensitive to temperature. The 432 representation (i.e., SWIR(4), NIR(3), and Red(2) bands in RGB display channels respectively) is especially effective for fire detection as active fires show up distinctively as bright red patches and smoke plume appears in faint bluish colour. This feature enables SPOT-4 to detect fires more effectively and efficiently than SPOT-1 and SPOT-2. A new way of presenting the SPOT-4 imagery is presented. The SWIR band lies in the spectral range of 1.58 to 1.78 mm. In this spectral range, radiance received by the satellite consists of both the reflected and the emitted radiances. The emitted radiance originates from the thermal radiation of the earth surface. It is highly dependence on surface temperature. Therefore, if we are able to separate the two portions of radiance, the surface temperature of active fire can be estimated.
2. SPOT-4 in Forest Fire Monitoring
2.1 Forest Fires Monitoring in CRISP
Since the forest fire episode in 1997/98, CRISP has carried out daily forest fire monitoring of the South East Asia region using SPOT imagery. The main objectives of the operation are to detect individual fires and to determine their nature in terms of the size of the smoke plumes, their locations and the landcover of the affected area. Fire detection is carried out by visual inspection of the full resolution SPOT images. In SPOT-1 and SPOT-2, fires can be identified from their smoke plumes that appear bluish white in colour. In most of the cases, they can readily be distinguished from clouds by their characteristic shapes. However, when the smoke is not thick enough or the cloud is too low, it is rather difficult to distinguish between the two. Once the fires are detected, a full SPOT scene covering the fire areas is processed to Level 1B. A fire report containing the locations (lat/lon), smoke plume conditions (length, width and thickness), wind directions of each detected fire is also made. When both the scene and the report are ready, they are sent to Ministry of Environment.
2.2 Fires in SPOT-4
SPOT-4, the fourth member of SPOT family, was launched in March 1998. It was only at late 1999 that CRISP started acquiring the SPOT-4 data. Together with SPOT-1 and SPOT-2, daily coverage of any given location in the region was made possible. The High Resolution Visible and Infra Red Instrument (HRVIR) of SPOT-4 satellite has four channels. The first three channels are identical with those of the previous SPOT system. The fourth channel lies in the spectral range of 1.58 to 1.78 mm, which is the short-wave infrared region of the spectrum. In this spectral range, satellite signal is relatively unaffected by atmospheric conditions. This unique feature has enabled SPOT-4 to capture relatively clear image. The SWIR is also very sensitive to high temperature. This is the major advantage of using SPOT-4 in forest fire monitoring.
One of the most commonly used colour composites of SPOT-4 is the 432 representation which is obtained by putting SWIR (4) in red, NIR (3) in green and RED (2) in blue. In this representation, vegetation appears green, fires appear as bright red patches and smoke plumes appear in faint bluish streaks. As compared to SPOT-1 and SPOT-2's 321 representation (i.e. NIR (3), RED (2) and GREEN (1) in RGB display), in which vegetation appears in red and smoke plumes appear in bluish white, the 432 representation is closer to natural colour. Unlike SPOT-1 and SPOT-2, fires can only be detected from their smoke plumes, which is sometimes rather difficult to be discriminated from cloud or haze. With SPOT-4's 432 representation, active fire that appears bright red in colour can easily be detected from its surrounding green vegetation and brownish burnscar.
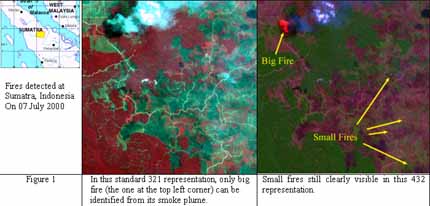
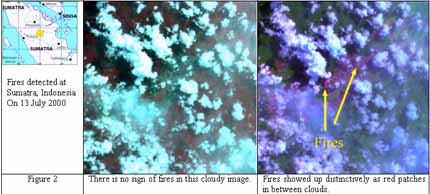
During the period of 4-16 July 2000, many fires were detected in Sumatra and Kalimantan of Indonesia. Some of the fires can only be detected by SPOT-4. In figure 1, the big fire on the top left corner is clearly visible in both representations. However, small fires indicated on the right image can only be detected by SPOT-4's 432 representation. In figure 2, in this cloudy image, there is no clear indication of fires on the left image. However, fires still show up distinctively as bright red patches in between clouds.
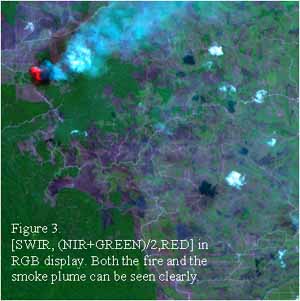
One disadvantage of the 432 representation is that the smoke plumes tend to be too thin for the purpose of determining the size of the plumes. Thus, we propose a new way of displaying the SPOT-4 images. This is achieved by replacing the NIR band by the average of NIR and Green bands in the 432 representation. In this manner, both the active fires and smoke plumes are clearly visible. In figure 3, the new way of displaying scheme is applied to the same image displayed in figure 1. The smoke plume of the big fire on the top left corner is now clearly visible as compared to the right image shown in figure 1.
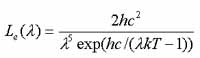
3.1 Radiance Received
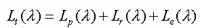
The radiance received by the satellite can be written as
3.2 Radiometric Calibration of SPOT-4
According to the SPOT's interface document, the level 2A image of SPOT-4 can be calibrated to physical radiance by
L = X / AG
3.3 Effective Wavelengths
In order to use Planck's equation to estimate the temperature, we need to know what wavelength to use in the equation. The effective wavelength, l e is the one which best fit the following equation
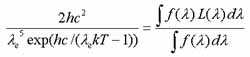
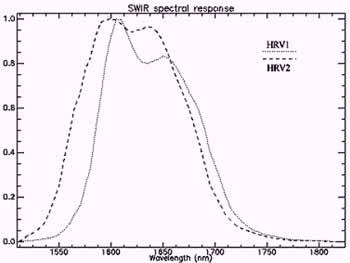
Figure 4 SWIR Spectral responses of the two HRVIR instruments
Forest Fire Monitoring with
SPOT-4 Satellite Imagery
3.4 Image Used
The image used in our study is the one shown in figure 1. The image was acquired on 7 July 2000 with instrument HRVIR2. The absolute calibration coefficient A is 5.49300 and the programmable gain G is 1.5. The digital value X of the big fire on the top left corner (refer to figure 1) is about 252. With this value, the corresponding radiance is computed to be 30.58 W/m2/sr/mm.
3.5 First Attempt in Temperature Computation
We first assume that the emitted radiance Le dominates the total radiance. This is motivated by the fact that most of the active fires can easily have temperature up to a few hundred degrees Celsius. Under this circumstance, the emitted thermal radiance is larger than the reflected radiance by a few order of magnitude.
Therefore, the emitted radiance is taken to be 30.58 W/m2/sr/mm. Since the image was acquired using HRVIR2, the effective wavelength l e is 1.636 mm. With these values, the temperature is readily be computed from the Planck's equation
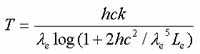
The temperature computed is 331.34 K that is equal to 58.34 °C.
3.6 Second Attempt in Temperature Computation
In our first attempt, the temperature computed is merely 58 °C which is far below a few hundred °C. This renders our assumption that the emitted radiance dominates the total radiance invalid. Therefore, we need to estimate the reflected radiance Lr of the active fire so that we can subtract it from the total radiance.
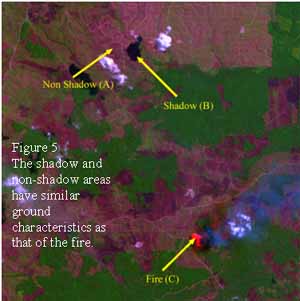
The total radiances of the two areas A and B as shown in figure 5 can be written as
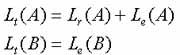
We find that the reflected radiance Lr of area A is about 9.30 W/m2/sr/mm. Hence we estimate that the emitted radiance Le of the fire C is 21.28 W/m2/sr/mm which is obtained by subtracting 9.3 from the total radiance of 30.58. With this value, the temperature of the active fire is found to be 53.34 °C.
The relatively low value of temperature may be due to the fact that in the 20x20m pixel only a small part of the area was actively burning. Therefore, the surface temperature computed is just the average temperature of the entire 20x20m area.
3. Conclusions
The temperature sensitive SWIR band has rendered SPOT-4 to be more effective and efficient in forest fires monitoring. Even small fires, which do not have smoke plumes at all, can be detected in SPOT-4's 432 representation. Another advantage of SPOT-4 is that the SWIR band is relatively unaffected by atmospheric effects, therefore fires under thin cloud or haze can still be detected. One setback of SPOT-4's 432 representation is that the smoke plumes tend to be too thin for the purpose of determining the size of the plumes. A new display scheme in which SWIR, (NIR+GREEN)/2, RED bands display in RGB channels respectively, are found to be more suitable in forest fires monitoring. Under this scheme, both fire and smoke plume are clearly visible. The total radiance of the SWIR band consists of the reflected and the emitted radiances. We found that by comparing two areas, one with shadow and another without, the reflected radiance of the active can be estimated. With this, the temperature of the active fire is found to be about 53 °C.
References
- S. C. Liew, O. K. Lim, L. K. Kwoh and H. Lim, "A study of the 1997 forest fires in South East Asia using SPOT quicklook mosaics", Proc. 1998 Int. Geosci. Remote Sensing Symp., Vol. 2, 879-881, 1998.
- S. C. Liew, L. K. Kwoh, K. Padmanabhan, O. K. Lim and H. Lim, "Delineating land/forest fire burnt scars with ERS interferometric synthetic aperture radar",. Geophysical Research Letters, 26(16), 2409-2412.
- V. Trichon, D. Ducrot and J. P. Gastellu-Etchegorry, "SPOT4 potential for the monitoring of tropical vegetation. A case study on Sumatra", Int. J. Remote Sensing, 20(14), 2761-2785, 1999