| GISdevelopment.net ---> AARS ---> ACRS 2000 ---> Environment |
The characterization of
vertical mean temperature Over indonesia from 1994 to 1998
Achmad Sasmito, Urip
Haryoko, Riris Adriyanto, Nelly Florida Riama,
Rosdiana
Meteorological Analysis Sub Division
Meteorological and Geophysical Agency
Jl. Angkasa I No.2 Jakarta10720, Indonesia
Ph.62-21-4246321, Fax.62-21-4246703
E-mail:anmet@bmg.go.id
Meteorological Analysis Sub Division
Meteorological and Geophysical Agency
Jl. Angkasa I No.2 Jakarta10720, Indonesia
Ph.62-21-4246321, Fax.62-21-4246703
E-mail:anmet@bmg.go.id
Key Words: vertical mean temperature, radiosonde, aerosol, global warming, cooling
Abstract
Recently climatologists have indicated that the global warming is currently happening as a result of human activities. Such evidences were shown by the increasing trend of surface temperature that taking place at a number of big cities and industrial areas all over the world. This just brings impact on microclimate but it doesn't have much influenced for the atmospheric mean temperature.
In fact, the analysis result of the atmospheric mean temperature based on radiosonde data observed in several big cities in Indonesia show the cooling between -2.730 and -5.510 from its normal. This indicates that nuclei condensation (aerosol) particles on the atmosphere over Indonesia were quite abundant. It can be related with the fact that Indonesia is an archipelago consists of thousand of islands - 70 % of Indonesian region is ocean.
On the other hand we can assume that the global warming that is usually connected with surface temperature cause the increasing of evaporation from ocean. And these aerosols will be trapped at mixing layer and cannot go higher. So that the propagation of sun radiation will prevent from going through and this cause the cooling temperature of atmosphere in this layer. The problem is how far from the surface that the global warming can affect the atmospheric layer.
1. Introduction
The symptoms of heat increase of the earth surface have become the growing concerns for scientists. Many theses have been proposed to find the causes of increasing global temperature. The increases have been taking place since the industrial revolution up to now. The main factor considering have role in global warming process is green house gases in the atmosphere.
It is believed that green house gases have an effect to trap heats. When the concentrations of the atmospheric green house gases increases, it will occur heat energy oscillation between earth surface and the atmosphere with green house gases content. The result is the air becomes hot and this condition is identified by the increase of mean temperature. The United State-Global Change Research Information Office (US-GCRIO) predicted that the earth temperature has increased 0.3 - 0.6o C during the last period of 19th century.
The increase of earth surface heat causes smelting of glacier resulting sea level rises. However, besides some regions have earth surface heat increase, the mean temperature in the other regions decreased (cooling process), This is probably because the effects of energy balance process occurring on the globe. If there is a changing action within a certain physical condition such as temperature increase in several areas, re-action will take place in to achieve equilibrium energy in other locations. It is believed that the total energy on the globe is always fixed. There is no energy lost but it can alter to be other form.
This study will explain the fluctuation or variation of vertical mean temperature in Indonesia regions and look the possibilities of global climate change impacts to the boundary layer atmospheric conditions. This study used 1994 to 1998 upper air data from 11 radiosonde stations in Indonesia regions.
2. Theoretical Overview And Data
2.1. Theoretical Overview
Atmospheric heating is basically taken place due to the interaction between solar radiation and any gases in the atmosphere. It is known that the atmosphere consists of various gases: permanent and impermanent gases; solid and liquid particles such as aerosol, ice crystal and water rainfall.
The permanent gases: nitrogen; oxygen and argon are almost 99.9% of total gases in the atmosphere. Such gases have fixed volume over 60 kilometers height. It is important to be noticed that CO2 is also considered as a permanent gas with various level of concentrations due to the result of fossil fuels burning. CO2 sinks into the ocean or is absorbed by plants by way of photosynthesis.
Atmospheric water vapor content varies every time depending on the atmospheric condition. The variation of water contents in the atmosphere is important because it relates to absorption and emission process of solar radiation. Furthermore, ozone concentration also varies from time to time. The concentration variation can be clearly seen on vertical direction with 15-30 Km height from the earth surface.
Ozone is generally formed in stratosphere layer. In mesosphere area, air temperature also decrease toward height from 50-85 kilometer. The layer above mesosphere area is called thermosphere layer. Air temperature in this layer is about 500o K to 2000o K. The outside of thermosphere layer is exosphere layer.
In meteorology air temperature and humidity in every atmospheric layer up to 20 km height can be determined by releasing radiosonde balloon. The vertically atmospheric mean temperature can be calculated by using the following formula (Bevis, et.al):
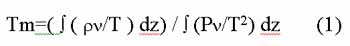
Pv and T are water vapor partial pressures (mb) and temperature. pv value is described as follows:
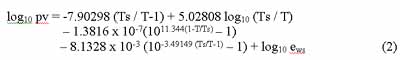
where T = temperature at certain height in absolute degree (° K); Ts = vapor point temperature (273.6o K) and ew= saturation water pressure at 273.6° K. (1 atmospheric standard = 1013.246 mb).
In analysis process it is also be used the following deviation method
R = Xi - Xs --------- (3)
Where R= deviation value; Xi= daily vertical mean temperature data; Xs = vertical mean temperature reference (10.00° C to 12.78° C).
2.2. Data
This study used 1994 to 1998 data from 11 radiosonde stations. The numerical calculation results by using the formula number 1 is the isopleth for vertical mean air temperature in Indonesia regions whereas the deviation of vertical mean temperature toward mean temperature reference is about 10.00 to 12.78° C (Fig. 1).
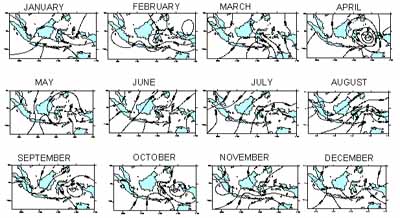
Figure 1. Isopleth for vertical mean temperature
3. Analysis
The observation results for upper-air temperature from the radiosonde can be used to determine water vapor content values in the atmosphere and the air stability. It also can be used to calculate other physical events such as vertical height, mixing depth and vertically atmospheric mean temperature. Davis, et al.(1985) pointed out that vertically atmospheric mean temperature value could be calculated by using the formula 1. The analysis result shows that the vertically atmospheric mean temperature values for every month in Indonesia regions are as follows:
In January, the vertical mean temperature in the south regions of the equator was relatively hotter than such temperature in the north regions of the equator. In the eastern part of Jawa, Ujung Pandang and Nusa Tenggara, the vertical mean temperature is around 280° K.
In February, the vertical mean temperature on this month in the Western part of Indonesia regions was generally higher than the temperature in the Eastern Indonesia. Minimum rate of vertical mean temperature, 283° K, occurred in Sumatera and Jawa.
In March, the temperature pattern in March is nearly similar to the temperature in February. The vertical mean temperature for the Western Indonesia was higher than the temperature in Eastern Indonesia regions, except for the big part of South Sulawesi and Nusa Tenggara.
In April, the vertical mean temperature in Indonesia was generally hot ( >282.5° K ), yet there was a cell of minimum vertical mean temperature, less than 282.5° K. Maximum air temperature, 283° K, occurred in almost Western Indonesian areas.
In May, the vertical mean temperature was relatively hot, more than 282.5° K. Maximum air temperature, 284° K, took place in the Northern part of Sumatera. Yet the mean temperature, less than 282.5° K, occurred in Tual, Saumlaki and some part of Merauke.
In the Western part of Indonesia, the vertical mean temperature on June was generally hot but the temperature became cooler in the Eastern areas. The maximum value of vertical mean temperature was about 284° K took place in North Sumatera, whereas the minimum rate of vertical mean temperature, 281.5° K, occurred in the Southern part of Irian Jaya.
The vertical mean air temperature pattern on July is the same as the temperature pattern on June. Yet the vertical minimum mean temperature areas are wider. Such areas encompass the southern part of Irian Jaya, Maluku and small part of East Nusa Tenggara. In addition, there is the closing cell of vertical mean temperature, 283.5° K in West Jawa.
In August, the vertical mean temperature pattern in the south equator regions was cooler than the temperature in the north equator areas. The maximum value of mean temperature, 283° K occurred in East Coast areas of Sumatera Island and the Western part of Kalimantan, whereas the minimum rate of mean temperature took place in surrounding Maluku and East Nusa Tenggara.
For September, the vertical mean temperature patterns in the western part of Indonesia: Western Sulawesi; Kalimantan; East and West Nusa Tenggara, and also Sumatera were generally hotter than other places in Indonesia. The minimum rate of vertical mean temperature, 282 °K took place in Ambon.
In October, the vertical mean temperatures in the Eastern regions of Indonesia were commonly cooler than other places in this country. The maximum values of vertical mean temperature happened in East Jawa, Bali, West and East Nusa Tenggara.
In November, Indonesian regions located in the south equator have commonly a higher vertical mean temperature than the northern equator areas. However, North Sumatera and Aceh have a relatively enough high mean temperature as the same as the temperature in the southern equator regions. The maximum vertical mean temperature value, 284° K occurred in East Nusa Tenggara.
In December, the vertical mean temperature patterns in the south equator areas in Indonesia were generally hotter than in the north equator regions. The minimum rate, 282.5° K took place in Biak whereas the maximum one, 283.5° K happened in East Nusa Tenggara and East Jawa.
Besides the analysis resulted the patterns of vertical mean temperature every month in Indonesia, it also gave the deviation rates of the existing vertical mean temperature toward the reference values: 10-12.78° C. The deviation values range from -2.73° C to -5.51° C.
4. Discussion
Analysis results show that the deviation of vertical mean temperature from all radiosonde stations toward the reference values namely 10.00o to 12.78o C were negative. The mean values varied from -2.73o C to -5.51o C. This means that the upper-layer atmosphere in Indonesia has not been influenced yet by the global warming occurrence.
Angell (1999) presented that there was heating process in atmospheric low layer due to surface mean temperature increase while in atmospheric upper layer showed there was cooling process. So if both atmospheric upper and lower layers are compared, it shows that there is action to reach equilibrium condition.
Increased surface temperature due to global warming occurrence can actually cause increased sea evaporation. Aerosol released by the sea evaporation process enters the atmosphere, but the aerosol cannot reach the outer space. The aerosol will be halted in a certain layer in the atmosphere called mixing depth so that there will be a huge number of aerosol in the atmospheric upper layer. As a result, solar radiation reaching the earth surface will be blocked by the aerosol so that air temperature in upper layer is lower than normal temperature. Accordingly, a question then arises, namely how many meters do the distance from the earth surface that the global warming effects has influenced the atmosphere?
It is understandable that surface temperature data is obtained from the measurement conducting at 2 meters height from the earth surface, and the data is usually taken in several big cities. Many studies have actually showed that the occurrence of micro climate change take places only few meters from the earth surface, and such a change much stronger horizontally run than vertically.
Considering the important role of atmospheric conditions, from the earth surface to the tropopause layer, in forming the global weather, it is crucial to understand either surface temperature or upper air temperature due to the global warming effects. Based on analysis results using vertical mean temperature data for 5 years long period (1994-1998), there has been a cooling process in the atmospheric upper-layer in Indonesia regions. This means that global warming event has cooling effects in the upper-layer. Indonesian areas known as tropical maritime continent, with 70% of the areas are sea.
Theoretically, Indonesia has a lot enough of nuclei condensation particles (NaCl) suspending in the atmosphere so that a long the way of solar radiation to reach the earth surface in Indonesia, it will occur a physical process between the solar radiation and aerosols. As a result, a few solar radiation re-radiates back to the outer space so the air temperature in the upper atmosphere becomes relatively low.
5. Conclusion
The deviation rates of vertical mean temperature in Indonesia toward the reference values were negative (-2.73o C to -5.51o C). This can be assumed that the upper atmosphere in Indonesia has a lot of nuclei condensation particles (NaCl) coming from sea-water evaporation so that the solar radiation re-radiates back to the outer space. This shows that Indonesia has characteristics as a tropical maritime continent.
The global warming issues due to human activities seem to give effects only in the atmospheric lower-layer while in the atmospheric upper-layer, cooling process takes place. This is indicated by the deviation negative values (-2.73o C to -5.51o C).
6. References
Bevis, M., Bussinger,S., Herring, T.A., Rocken, C., Anthes, R.A., and R. H. Ware, 1992. GPS Meteorology: Remote Sensing of Atmospheric Water Vapor Using the Global Positioning System. Journal of Geophysical Research, Vol. 97, No. D14, pp 15.787 - 15.801.
Davis, J.L., A. Herring, T.A., Shapiro, I.I.,A.E. Rogers, A.E., and G. Elgered, 1985.Geodesy by Radio Interferometry: Effects of Atmospheric Modelling Errors on Estimates of Baseline Length. Radio Sci., 20, pp.1953 - 1607.
Herring, T.A., Anthes, R.A., Rocken, C., and R.H. Ware, 1993. GPS Meteorology: Mapping Zenith Wet Delays onto Precipitable Water. Journal of Applied Meteorology,
Liljegren, J.C., Lesht, B.M., Van Hove, T., and C. Rocken, 1999. A Comparison of Integrated Water Vapor from Microwave Micrometer, Balloon-Borne Sounding System and Global Positioning System, Ninth ARM Science Team Meeting Proceedings, San Antonio, Texas (March 22-26, 1999).
Sasmito, A. 1998 : Characteristic Sea Surface Temperature in Eastern Indonesian Region to Detect of the ENSO Phenomenon, Paper Presented on Conference of Meteorology and Geophysics for Mitigation of Natural Disaster, Hanoi, Vietnam, October 13, 1998.
Smith, E.K. and S. Weintraub, 1953. The Constant in the Equation for Atmospheric Refractive Index at Radio Frequencies. J. Res. Natl. Bur. Stand, 50, pp.39 - 41.
Ware, R.H., Alber, C., Rocken, C., F. Sonheim, 1997. Sensing Integrated Water Vapor Along GPS Ray Paths. Geophys. Res. Let., Vol. 24, No. 4, pp 417 - 420.