| GISdevelopment.net ---> AARS ---> ACRS 2000 ---> Environment |
Environments transition
research in yusan national park After earthquake and typhoon
Tien-Yin Chou , Chih-Cung
Kao , Ying-Huei Chang
Mr., Geographic Information System Research Center
Fung Chia University
Geographic Information System Research Center,Fung Chia University
, 100 WenHwa RD., Taichung,TAIWAN
Tel: +886-4-4516669 ext. 59 Fax:+886-4-4519278
E-mail: cckao@gis.fcu.edu.tw
Mr., Geographic Information System Research Center
Fung Chia University
Geographic Information System Research Center,Fung Chia University
, 100 WenHwa RD., Taichung,TAIWAN
Tel: +886-4-4516669 ext. 59 Fax:+886-4-4519278
E-mail: cckao@gis.fcu.edu.tw
Key Words: Remote Sensing , Geographic Information Systems
Abstract
It always follows a huge lost after the disaster happens. It's more serious in Yushan National Park cause its wide area. It always takes a lot of people, goods and materials to relieve the victims of a disaster. If we can find out the affect carried by those disaster immediately, we can make better policy decision to rebuild and recovery plan. Our study use Remote Sensing technology and Geographic Information System to analysis the Environments Transition in Yushan National Park after earthquake happened in September 21 in 1999 and the typhoon happened in August 1 in 1996.and find out if any facilities damaged on these two disasters. We attempt to offer a powerful suggestion for National park management organization and will be helpful when they want to rebuild the facilities broken in the disasters.
I.Introduction
It always follows a huge lost after the disaster happens. It's more serious in National Park cause its wide area. It's more important to distribute the succor resource before we send the People, goods and materials to relieve the victims of a disaster. Our study trying to use remote sensing technology monitor the transitions of land cover after the disasters. And we also analyze the effect of the disaster with the assistance of Geographic information systems. For this purpose, we choice Yushan National Park to deliberate the earthquake happened in September 21 in 1999 and the typhoon happened in August 1 in 1996 effects. We hope our research can offer a powerful suggestion for National park management organization and will be helpful when they want to rebuild the facilities broken in the disasters.
II.Methodology
Our research wants to find out the relationship between disaster and transitions of land cover. For this purpose we used Remote sensing technology, Geographic Information Systems, land cover classification theory and environmentally sensitive area correlation studies. First we choose the National park in middle part of Taiwan - Yusan National Park. The central region of Yusan National Park takes 10 hectare, which covered Nanto, Kaohsiung, Hualien and Jangyi four counties. There are four rivers and 100 mountains inside. Just like the other National Park in Taiwan the land cover monitor and management become the biggest problem for the management organization. This problem especially effects after two huge disasters in middle part of Taiwan. Typhoon Hobo effects at August 1, 1996 and the earthquake happened at September 21, 1999.
We Use three SPOT images that pictured in 1993,1996 and 1999. Last two images are pictured just after typhoon and earthquake. And all three images are level 10 standard images. Classify images to four classes to see if anything changes during the disasters. And respectively compare the land cover situation between two images to see what changes since 1993 to 1999 in Yusan National Park. At last, we respectively overlay the land cover map, geologic map, topographic map and stature map to find out the relationship between these land factor and different disasters. According to some reference collected from R.O.C. we also delimit the environment sensitivity area at Yusan National Park.
III.Research Topics
This research aims at the land cover of Yusan National Park after hazard. The research topics are as follows:
- An analysis of land cover after disaster in Yusan National Park.
- Land covers transition of Yusan National Park since 1993 to 1999.
- Bare ground distribution analysis.
- Disasters Sensitivity analysis.
1.Land Cover Analysis
First, We make an image enhancement for classification reference. Than we simply used supervise and Unsupervised methods on classification progress. Caring about mountainous region always have lots of shadow, we separate the image to Shadow part and the other in progress. And we also use air photos and rainy records to modify the misconstruction between real water area and temporary water cause by the big rain during image pictured. After Classification procedure, we progress the image to four classes. They are bare, wood, grass and water. The distribution Area and percentage at 1993,1996 and 1999 are given in table 1.
|
Year Class |
1993 |
1996 (After the typhoon) |
1999 (After the earthquake) | |||
| Area | Percent | Area | Percent | Area | Percent | |
| Grass | 14668.47 | 14.09 | 12877.2 | 12.37 | 13238.1 | 12.72 |
| Bare | 6583.28 | 6.33 | 9356.33 | 8.99 | 8543.47 | 8.41 |
| Wood | 81105.24 | 77.93 | 79303.5 | 76.2 | 78818.6 | 75.73 |
| Water (river) | 1114.14 | 1.07 | 1816.08 | 1.74 | 1089.73 | 1.05 |
| Cloud | 605.91 | 0.59 | - | - | 2326.42 | 2.24 |
| Total | 104077.04 | 104077.04 | 104077.04 | 104077.04 | 104077.04 | 104077.04 |
After classification we make an accuracy assessment according to the data on the spot. The result is user accuracy is 84.62% and producer accuracy is 83.78%.
2. Land Cover Transition analysis
We respectively compare the transition from 1993 to 1996 and 1996 to 1999. The conclusions are as follow:
- Transition analysis of 1993 to 1996
In 1993 to 1996, most part of land cover in the Park is similar. It shows that National Park is profit for environment nursling. But it also have 3.94% land cover situation translate from woods to bare land and 2.76% translate from grass to bare land. The big fire happened during these three years may be one of the reason. - Transition analysis of 1993 to 1996
In 1996 to 1999,there are 78.16% land cover didn't change in these years. But similar as 1993 to 1996, there also have a part of plant disappears. Fortunately the transition from bare land to plant is also increase at these three years.
To make a comprehensive survey from 1993 to 1999, Yusan National Park goes through two huge disasters and several fire accidents. It's a pleasure to see that most part of land cover is still remaining as before. But the 3% bare land translate situation is also a big problem needed to be concerned. Consider about the distribution of transitions, we overlay geology, topography and fire accidents distribution maps. It shows that the transitions always happen around the road, river and other human activities area. Obviously human activity is a serious problem in a natural nursing region. - Bare ground distribution analysis
Bare land distribution is an important factor of disaster effects in national park. We search and collect the geology, topography, stature and some land use data for bare land analysis by Geographic information Systems. We take out the bare land part from image overlap with other land use maps. The conclusions are as fig1, fig2.
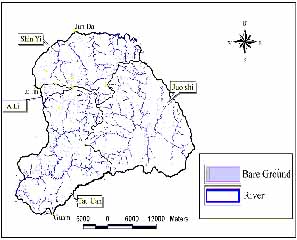
Fig 1 bare land overlap with river at 1996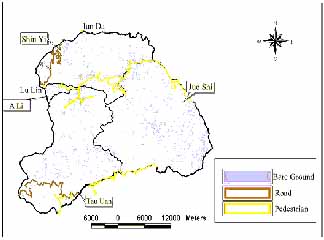
Fig 2 bare land overlap with road at 1999
As the overlap map shows, most bare land distribute around the road and river. Compare the distribution in 1996 and 1999 we also discovered that the bare around the river are critical after typhoon at 1996. The state of affairs shows that big rain must be one critical factor of bare around rivers.
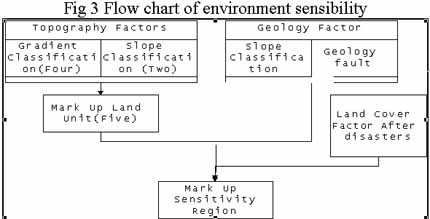
- Disasters Sensitivity analyses
VI.Research Resoult
Our research uses the Remote Sensing and Geographic Information Systems to progress the analysis from the Yusan National Park after Typhoon and the earthquake 921,the analysis from the character of bare lands, and the sensitivity of environment. The conclusion are bellowing:
- This research applying Remote Search to investigate the covering of land in Yusan National Park from 1996 to 1999. Their precision can be more than 80% in every class. And precision of the class which is about the woods reaches 93.53% and 93.94%. It is known that Remote Search is a kind of excellent way to examine the land use of large area, and also can be applied to the examination and monitoring of the land in high mountain and resources of woods.
- According to the result of examination of land covering, it is obvious that there's no change between 1993 and 1996 from 83.5% of classifications of land covering around Yusan National Park (There are Woods, Grasses, Bare Lands, and Water), and the rate remains 78.16% between 1996 and 1999. The area of woods occupied 75.73% in 1999. It is clearly to know Yusan National Park is workable about nursing living things and also the importance of establishment of Yusan National Park.
- It is showed that there are six-degree slope mostly in Yusan National Park according to the examination of its own natural environmental characters. And it is also showing that the terrain is dangerously steep. Also the geology there is fragile and mainly schist and slate .are there.
- It is showing that the close relationship between the spread of bare lands and pedestrian precinct according to the result of bare lands change analysis. It is deserve to be mentioned that lots of landslip happened after earthquake around the north peak which slope is bigger then 55%. And the Slide happened after the typhoon is always around the rivers. And these places are also on top of human activities region. It might a warning of the management organization.
- McCauley, J. D., and B. A. Engel, 1995, Comparison of Scene Segmentations:SMAP, ECHO, and Maximum Likelihood.IEEE Transactions on Geoscience and Reomte Sensing.33(6)
- Zhu, Z., and D. L. Evans,1994, U.S. Forest Types and Predicted Percent Forest Cover from AVHRR Data, Photogrammetric Enginneering & Remote Sensing, 60(5).
- Zhuang, X., and B. A. Engel,1991, Improving Classification of Crop Residues Using Digital 4.Land Ownership Data and Landsat TM Imagery. Photogrammetric Engineering & Remote Sensing,57(11).
- John, J.R.,1986, " Introductory Digital Image Processing", Prentice-Hall, New Jersey.
- Chapin, S.J. and E. J. Kaiser,1985, "Urban Land Use Planning", University of Illiois Press, Illiois.
- Hall P., 1992, "Urban and Regional Planning", Routledge, New York.