| GISdevelopment.net ---> AARS ---> ACRS 2000 ---> Environment |
Urban Change Study Using RS
And GIS
D.Amarsaikhan,
M.Ganzorig
Institute of Informatics and RS, Mongolian Academy of Sciences
av.Enkhtaivan-54B, Ulaanbaatar-51
E-mail: informc@magicnet.mn , amaraa66@hotmail.com
MONGOLIA
M.Saandar
MonMap Engineering Services Co., Ltd
r.502, Sarora Hotel, Seoul street 12/6, Ulaanbaatar-46
E-mail: monmap@magicnet.mn, msaandar@mongol.net
MONGOLIA
Key Words: Urban, Ger, Building Parcels, Multi-Temporal, RS, GIS
Abstract
The aim of this study is to investigate the urban changes that have occurred in central part of Ulaanbaatar area, Mongolia over the past few decades and describe the socio-economic reasons for the changes. For this purpose, multi-temporal RS and GIS data sets are used. For the analysis, two classes such as ger area (a Mongolian national house) and building parcels are selected and compared.
Introduction
In recent years, cities all over the world have experienced rapid growth because of the rapid increase in world population and the irreversible flow of people from rural to urban areas. Specifically, in the larger towns and cities of the developing world the rate of population increase has been constant and nowadays, many of them are facing unplanned and uncontrolled settlements at the densely populated sites or fringes. To prevent from such occasions urban planners need detailed updated maps for thorough planning and management. However, most city planners have a lack of such maps and often they posses old data which is not relevant for current decision making. Even if they do not hold a detailed updated map of the city area a regularly updated map with an acceptable resolution can at least give them an impression about the changes in the city area [3,4,5,7].
Mongolia, as many of the developing countries has a problem with the urban expansion and the growth of population in the main cities. For example, over the last decades Ulaanbaatar, the capital city of Mongolia has significantly expanded due to different development activities and migration of people from rural sites [7]. Various changes have been and are being occurred in the city but there are no regularly updated maps to indicate those changes. In general, it should be interesting to study the urban growth in the capital city comparing the growths occurred before 1990 when Mongolia had centralized economy with the changes occurred during the market economy.
The aim of this paper is to detect the main changes occurred in central part of Ulaanbaatar area before and after 1990 and describe the socio-economic reasons of these changes. For this purpose, multi-temporal RS and GIS data sets have been used. For the study, two classes such as ger area (a Mongolian national house), and building parcels (parcels of apartments, residential houses and industrial buildings) have been selected and compared. The analysis was carried out using ERDAS and ILWIS-systems and different RS and GIS techniques have been applied.
The GER
Mongolian dwellings have evolved with nomadic life. The need for a portable dwelling is obvious for people following their herds and seeking new pastures. The history of the Mongol ger goes back to about 2500-3000 B.C. and has continued to be used to the present day. The ger is still used as dwelling everywhere in Mongolia. The walls of the ger are made of narrow birch willows formed into a lattice framework and held together by leather strips. Sections of the lattice are put together in a large circle to form the walls. Each section is approximately five to six feet high and seven to eight feet long. The entire outside surface of the ger is covered with felt, tied in place by ropes made of hair and wool. One layer is sufficient in the summer season. Two or three layers are necessary in winter. The ger is comfortable in all kinds of weather. In hot summer, the root wheel is opened and the felt walls are raised to give ventilation. When it is windy the ger is stable becuase of its shape and is tied to the ground and in cold winter the layers of the left are increased and the door is sealed. The assembling and taking down of any ger are done within half an hour in as fixed order. The gers situated in urban areas are surrounded by fences, whereas the gers of herdsmen in rural sites do not have fences because they move from place to place following good pasture area. The gers of rural herdsmen are shown in figure1.
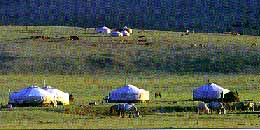
Figure 1. The gers of rural herds people
The Test Site
As a test site Ulaanbaatar, the capital city of Mongolia has been selected. Ulaanbaatar is situated in the central part of Mongolia on the river Tuul at a height of 1350 m above sea level and currently has approximately 650,000 inhabitants [7]. The city is surrounded by mountains which are spurs of the Hentii range. The temperature of Ulaanbaatar is about 20-25°C above zero in summer but in winter it is usually 15-20°C below zero. The mean precipitation in the city is 233 mm [8].
Data Sources
- A topographic map of 1969, scale1:25.000
- SPOT XS image of 1986
- SPOT PAN data of 1990
- SPOT XS image of 1997
- Census data of Ulaanbaatar.
Analyses And Discussion
In our study, we assumed that there is an operational GIS that stores an old city map and multi-temporal RS data sets. To acquire primary digital data stored within the GIS the selected classes: a ger area (a Mongolian national house) and building parcels were digitized in a UTM map projection from a topographic map of the test area, scale 1:25.000. There have been selected only two classes because on the satellite images it was not possible to distinguish between land parcels related to apartments, residential houses and industrial buildings. The digitized city map is shown in figure2. To define the total area of each class the vector map was rasterized with a pixel size of 10m and then a number of pixels falling into each of the classes has been calculated. The result indicated that in 1969, ger area covered 624ha whereas building parcels occupied 1566ha. Although, we have census data of Ulaanbaatar, it is not possible to directly relate it to our analysis because due to a lack of data, our study area covers more central and western parts and a part of eastern block of the capital city. Therefore, census data has been used to see just general increase of population at different years. As it was seen from the census data, in 1969 the city had 267.400 inhabitants.
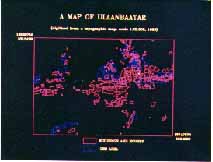
Figure 2. A digitized city map of Ulaanbaatar
As it has been mentioned before, the aim of the study is to compare the changes occurred in central part of the city during the centralized economy with the changes occurred during the market economy. For this purpose, SPOT PAN data of 1990 and SPOT XS image of 1997 could be compared with the digital GIS data. However, for the interpretation it is better to use a colour image if it is available. Therefore, to have more spectral variation of the selected classes, SPOT PAN data was integrated with SPOT XS image of 1986. The processing of the images has been carried out as follows [1,2]:
Initially, all the images were thoroughly analyzed in terms of distortion and brightness. The images were of a good quality but only the panchromatic data had to be radiometrically corrected. Radiometric correction of panchromatic data was done by averaging upper and lower lines of the stripes that had to be corrected. Then, SPOT images of 1986, 1990 and 1997 were successively geometrically corrected to the UTM map projection using the same topographic map of the study area. The ground control points were selected on well defined cross sections of linear features. For the actual transformation, a second order transformation and nearest neighbour resampling approach have been applied and the related RMSs were 0.38, 0.47, 0.58, respectively. Further, from each image the same set of subsets falling into the same image frame has been chosen. To create an integrated colour image the multispectral image was firstly sum normalized in order to eliminate different influences and then multiplied by the intensity of the panchromatic data. After this, the normalized bands have been assigned to RGB colours accordingly (figure3).
It can be expressed by the formula:
R=(NIR/NIR+R+G)*PAN
G=(R/NIR+R+G)*PAN
B=(G/NIR+R+G)*PAN
where NIR,R,G - bands of SPOT-XS, and PAN - panchromatic band.
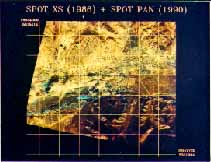
Figure 3. The integrated image of Ulaanbaatar (SPOT XS-86 + SPOT PAN-90)
To create a city map of 1990, on the enhanced image the selected classes were screen digitized and then rasterised with a pixel size of 10m. Moreover, the statistics of each class was calculated. The result indicated that the ger area and building parcels covered 1236ha and 1987ha, respectively, while population of the city had become 574.900. As seen, within a 21 year period, ger area increased by 98% and building parcels increased by 27%, while population had increased by more than 2 times. It has the following reasons:
- during the centralized economy, due to the industrialization process in the city many people came from rural sites with their gers to the city;
- gers are surrounded by fences covering usually 600-800sq.m, thus covering large area;
- during the socialist economy as residential houses mostly building blocks with many floors and flats were built. Although, a few residential blocks could contain families of a whole ger district, they occupy much smaller land parcels than gers' parcels.
A map indicating the changes occurred in Ulaanbaatar area during the centralized economy is shown in figure 4.
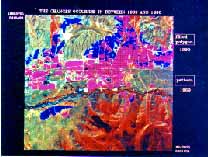
Figure 4. A map indicating the changes occurred in Ulaanbaatar area in between 1969 and 1990
To investigate the changes that have occurred in the city during the market economy a false colour image was created using SPOT XS bands of 1997. For the improvement of the interpretation and the detection of the boundaries between the selected classes of objects, band 3 of the colour image was edge-enhanced using a 3x3 convolution filter (central pixel 10 and other values -1). The created colour image is shown in figure5.
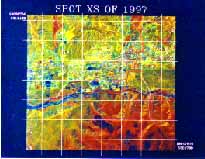
Figure 5. Enhanced image of SPOT XS-97
Then, on the enhanced image the selected classes were screen digitized. Furthermore, the digitized vector map was rasterised with a pixel size of 10m and the total number of pixels falling into each of the classes has been calculated. The result indicated that during a 7 year period ger area had increased by 50% while building parcels had increased by 48%. At the same time, population of the city had become 649.800. The reasons for these changes are:
- due to the market economy people moved to the area with a good infrastructure;
- during the market economy income of people has increased and the built houses are mostly cottages or houses with few floors, not like building blocks;
- due to the new land law which gives a distinct right to land owners [6], the interest of people to own land parcels has increased.
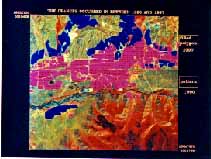
Figure 6. A map indicating the changes occurred in Ulaanbaatar area during the market economy
Conclusions
The overall idea of the study was to compare the general changes occurred in central part of Ulaanbaatar area during a centralized economy with the changes occurred during a market economy and describe the socio-economic reasons for these changes. For this purpose, multi-temporal RS and GIS data sets were used. As seen from the analysis, during the centralized economy significant changes occurred in the ger area of the city, while during the market economy significant changes occurred in both areas. Surely, this is just a rough estimation of the changes of the capital city. For the proper estimation, large scale maps and very high resolution satellite data (eg, IKONOS) or aerial photographs covering all areas should be used.
Acknowledgement
The authors are very grateful to Ms.O.Tsolmongerel and Ms.Sh.Tumentsetseg for digitizing a city map of Ulaanbaatar area, and Dr.P.Galsan for his valuable advice in the study.
References
- Amarsaikhan, D., Tsolmongerel, O., 1997. Some Results Of Using Spatial Enhancement Techniques. Journal of Informatics, Ulaanbaatar, Mongolia, pp61-68.
- Amarsaikhan, D., Ganzorig, M., Tsolmongerel, O., 1997. Comparison of Spectral Enhancement Techniques. Journal of Informatics, Ulaanbaatar, Mongolia, pp35-39.
- Dirk Bolt, 1996. An Urban Community Strategy For Implementing Decentralization And Devolution Policies. ITC Journal 1996-1, pp18-28.
- Hans de Brouwer, Carlos R Valenzuela, Luz M Valencia, Koert Sijmons, 1990. Rapid Assessment of Urban Growth using RS-GIS. ITC Journal 1990-3, pp233-235.
- Jan Turkstra, 1996. Urban Growth And Land Use Options For Lower-Income Groups: A Case Study Of Villavicencio, Colombia. ITC Journal 1996-1, pp57-64.
- Land Law of Mongolia, 1994. New Land Law of Mongolia. Ulaanbaatar, Mongolia.
- Statistics Report, 1999. Statistics Report Intended to the 360th Anniversary of Ulaanbaatar. Ulaanbaatar, Mongolia.
- Tsegmid, Sh., 1969. Physical Geography of Mongolia. Ulaanbaatar, Mongolia.