| GISdevelopment.net ---> AARS ---> ACRS 2000 ---> Environment |
An Evaluation of Drought Risk
Area in Northeast Thailand using Remotely Sensed Data and GIS
C. Mongkolsawat, P.
Thirangoon, R. Suwanweramtorn, N. Karladee, S. Paiboonsank, P.
Champathet
1Computer Centre
2Department of Computer Science 3Faculty of Agriculture
Khon Kaen University, Khon Kaen 40002 Thailand
Email : charat@kku.ac.th
1Computer Centre
2Department of Computer Science 3Faculty of Agriculture
Khon Kaen University, Khon Kaen 40002 Thailand
Email : charat@kku.ac.th
Key Words: Drought, GIS, Northeast Thailand
Abstract
In Northeast Thailand, drought has the most profound effect on the way of living and regional economy. It is also a major menace to regional food supplies. By its severity and duration these events can be disastrous not only locally but for the whole economic structure. Hence knowledge of the drought risk area of their occurrence and their course is an essential aspect for planning. Remotely sensed data and GIS is widely accepted as a tool for the establishment of integrated information. Drought risk area, by nature, is a result of interrelated parameters concerned. The objectives of this study were to model the drought risk area with a set of themes using remotely sensed data and GIS. The study area, Northeast Thailand, covers an area of about 170,000 km2 or about 1/3 of the total area of the kingdom. The underlining concept of the paper is that the severity of drought can be considered as being a function of rainfall, hydrology and physical aspect of landscape. A set of these themes were studied and reviewed. In terms of the water deficiency, these mainly include meteorological drought, hydrological drought and physical drought. Each theme of the drought consists of a set of logically related geographic features and attributes is used as data input for analysis. Establishment of each theme based on the overlay of the theme or individual theme layer. Meteorological drought was performed using mean annual rainfall data of minimum 15 years record of 264 stations. Hydrological drought was analyzed by overlay process of surface water, irrigated area, density of stream within sub-watershed and ground water yield and quality. Physical drought was formulated from a combination of spatial information of landform, drainage condition and land use by the matrix overlay function. A number of theme layers were extracted either mainly or partly from Landsat TM data of December 1998, these included surface water, land use, land form and drainage condition. In addition, the other theme layers were derived from map produced by the governmental agencies. The matrix overlay operation of the 3 drought risk layers was then performed and yielded the resultant polygonal layer. Each of which is homogeneous area with respect to each of the drought layer, there are then classified into 4 classes of drought risk: very mild, mild, moderate and severe. The study indicated that high drought risk areas are found in the Southwest and extended to Northwest of the region. The low risk areas are located along the Mekong River. To evaluate its reliability, the resultant drought risk map, produced using GIS was checked against the survey data (NRD2C) of the National Economic and Social Development Board. In addition the drought regions developed were verified with the information acquired by interviewing the sub-district official committees. It is found to be satisfactory. The study confirms that the model developed can greatly enhance drought risk area mapping in the Northeast.
1. Introduction
Northeast Thailand contains one-third of the total population and land area of the kingdom. Over 70% of the population is engaged in agriculture which dominated by rain-fed production. At the present time, less than 6% of the cultivated land in northeast is irrigated, leaving the majority of farmers operating in rain-fed conditions (Rigg, 1985). In addition, water shortage for domestic consumption is usually identified as principal constraint for the people during the dry season. Lack of water or drought in the region has profound impact that can be listed as economic, social and environmental. The eighth National Economic and Social Development Plan(1992-1996) called for achievement of water resource sustainability (NESDB 1992). The plan describes development issues and problems with the guidelines for developing water resources. Drought risk area, by nature, is a result of a variety of factors. Drought in general originates from less precipitation over an extended period of time. These include occurrence of no rain in the rainy season, number and amount of rainfall event and other climatic anomalies. Palmer (1965) identified monthly index values for past dry periods to yield an equation for calculating drought severity in four classes. In an operational definition of drought it identifies drought from impact data (i.e. crop damage). The drought pattern should be started with an assessment of rainfall which orignates capital water. It is widely accepted that combination of physical nature of area, amount of rainfall and water resource development leads to identify the drought pattern. In northeast Thailand, mean annual rainfall is about 1285 mm./annum, the region has yet significant impact of drought in a various part of the region (Wongvitawas 1993). Erratic distribution of rainfall, shallower water reservoir, low water holding capacity of soil and erosion sediment are major causes of drought. Koonthanakulwong (1990) concluded the drought on the basis of the number of days with rainfall less than specified threshold. Anukularmpai et al (1980) applied gamma distribution to predict minimum monthly rainfall in Thailand. Saenjan et al (1990) reported the frequency rainfall occurrence in the northeast and mapped along with a measure of their variability. Department of Environmental Planning and Policy (DEPP) (1996) established the drought risk areas in the northeast using GIS for spatial overlay of variable layers: rainfall index, soil water holding capacity, irrigated area, ground water yield, rainfall probability and land use. There still exists the gap in the methods used and details of the thematic layers established. Another study of rainfall in the northeast made by Siripon et al (2000) concludes that the unevenly distributed rain fall over the rainy season is found extensively and extends longer period in the southwest and the central part of the region. This phenomena is frequently occurred in the second half of June and of September for the areas in southwest and northeast of the region respectively. The information obtained from limited studies still requires a more detail identification of spatial pattern of drought. This is to support the government in allocating water for rural consumption more accurately and at the right place. Computer-based analysis and GIS can addresses this issue with higher accuracy, based on the integration of meteorological, hydrological and physical data of the areas. The purpose of this study is to model drought risk area using GIS with a set of data layers empirically evaluated.
2. Study Area
Northeast Thailand, one of the distinct main physiographic feature of Thailand, covers about one-third of the total area of the kingdom. It lies between the latitude of 14° and 19° N and the longitude of 101° and 106° East. Physiographically, the main area of northeast Thailand is formed by the so-called Korat plateau and a part of central highland. In the Korat plateau, the Phu Phan range lies in Northwest Southeast direction, dividing the plateau into two basins, the larger, Korat basin to the South and the smaller Sakon Nakhon basin to the North. The central highland covers narrow range along the western part of the region.
3. Methodology
The underlining concept of the paper is that the severity of drought is a function of rainfall, hydrology and physical aspect of landscape. Each of which is a thematic data layer that is a result of a analysis of sub layers or individual layer. The three thematic data layers are then combined to ultimately formulate a composite output layer or drought risk area. The schematic chart of this analysis is shown (Fig 2).
3.1 Rain analysis
Daily rainfall data from 264 stations across northeast Thailand covering at least 15 years record were compiled as point database for analysis. Calculation of mean annual rainfall was made at each station. Kriging interpolation was performed to establish spatial mean annual rainfall across the entire northeast Thailand. The threshold of mean annual rainfall was then identified using decile range to create the decile rainfall.
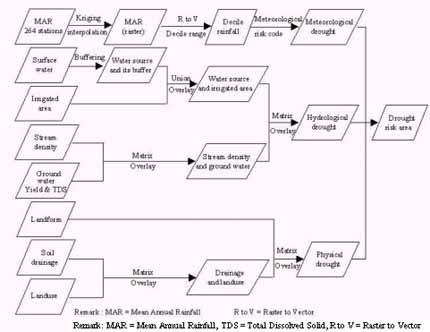
Fig 2. Schematic chart of drought analysis
The decile rainfall of 10 classes was grouped into 4 levels of drought severity that so called meteorological drought.
3.2 Hydrological analysis
Input data layers for hydrological drought include surface water source, irrigated area, stream density in subwatershed and ground water yield and quality. Surface water source and irrigated area were derived from 14 scenes of Landsat TM acquired during December 1998-February 1999 and data collected by the site project of the Royal Irrigation Department respectively. Stream density was calculated from stream length within subwatershed area. Ground water yield and quality at scale of 1:100,000 is available from the Department of Mineral Resources. Each input map layer was digitally encoded in GIS database. To generate the hydrological drought the matrix analysis was performed for every coincidence of classes in two layers (Fig 2). The variables class and severity of drought are given in table 1.
3.3 Physical landscape Analysis
Land form, drainage condition and land use are input variables for analysis of physical drought. Preparation of land form and land use maps were done using the Landsat TM acquired as above. Drainage condition map was compiled from soil map 1:50,000 of Land Development Department. Digital map of each layer was performed using GIS functions. The digital output of the physical drought is a combination of 3 input variables. The analysis and procedure were executed the same as those performed for the hydrological drought. (Fig 2 and table 1)
Table 1 variables,class and drought severity
| Variables | Class | Drought severity |
| Mean annual rainfall (Decile range) | 0 - 1130.065 mm. | 4 |
| > 1130.065 - 1276.133 mm | 3 | |
| > 1276.133 - 1431.076 mm. | 2 | |
| > 1431.076 | 1 | |
| Irrigated area and water source | Water source 0 - 0.5 km2 | |
| Area beyond water source >0.5 km. | 4 | |
| Area beyond water source >0.12 - 0.5 km. | 2 | |
| Area beyond water source 0 - 0.12 km. | 1 | |
| Water source 0.5 - 5 km2 | ||
| Area beyond water source >1 km. | 4 | |
| Area beyond water source >0.25 – 1 km. | 2 | |
| Area beyond water source 0 - 0.25 km. | 1 | |
| Water source 5 –10 km2 | ||
| Area beyond water source >1.5 km. | 4 | |
| Area beyond water source >0.5 – 1.5 km. | 2 | |
| Area beyond water source 0 - 0.5 km. | 1 | |
| Water source > 10 km2 | ||
| Area beyond water source >3 km. | 4 | |
| Area beyond water source >1 - 3 km. | 2 | |
| Area beyond water source 0 - 1 km. | 1 | |
| Area within irrigated area | 1 | |
| Groundwater yield and TDS. | 3 m2 / hr. & TDS. > 1500 mg/l | 4 |
| 2 - 10 m2 / hr. & TDS. > 750 - 1500 mg/l | 3 | |
| 10 –20 m2 / hr. & TDS. <750 mg/l | 2 | |
| >20 m2 / hr. & TDS. <750 mg/l | 1 | |
| Stream density | 0 – 120.98 m/ km2 | 4 |
| 120.99 – 248.17 m/ km2 | 3 | |
| 248.18 – 406.89 m/ km2 | 2 | |
| >406.89 m/ km2 | 1 | |
| Land form | Mountainous | 4 |
| Dissected erosion surface | 3.5 | |
| High terrace | 3 | |
| Middle terrace | 2.5 | |
| Low Terrace | 2 | |
| Flood plain | 1 | |
| Drainage condition | Excessively drained | 4 |
| Well drained | 3.5 | |
| Moderately drained | 3 | |
| Somewhat poorly drained | 2.5 | |
| Poorly drained | 2 | |
| Very poorly drained | 1 | |
| Land use | Field crop / Deciduous forest / Village | 4 |
| Mixed field crop / Forest and mixed crop | 3.5 | |
| Grass land / Shrub / non-use | 3 | |
| Mixed paddy / Mixed ever green forest | 2.5 | |
| Tree / Fruit tree / Swamp and other | 2 | |
| Paddy / Mixed fruit tree / ever green forest | 1.5 | |
| Water source / Riparian / Swamp | 1 |
3.4 Drought risk area
The resulting thematic data layers were then combined by matrix analysis to produce the drought risk area. The drought risk area represents the integration of meteorological drought, hydrological drought and physical drought which in turn are assigned according to the drought criteria studied.
4. Results and Discussion
Result of the overall drought risk area are shown in Fig 3d and has 4 classes : very mild, mild, moderate and severe. The severe drought area covers mainly in the southwest of region and has approximately 11.20% of the northeast. The moderate drought area extends around those of severe class and has about 32.06%. The some of very mild areas have occurred in the southwest region where water source and irrigated area was developed. The very mild and mild drought areas are found extensively in the eastern and northeastern part of the study area, particularly along the Mekong river. The areas occupied by the different kinds of the droughts are summerized in table 2.
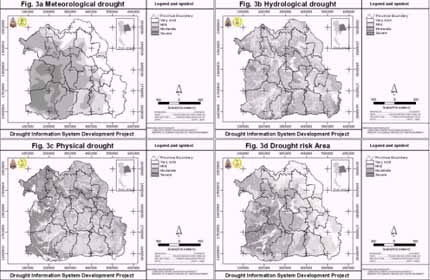
Fig 3 : Meteorological Drought, Hydrological Drought, Physical Drought and Drought risk Area.
Table 2 Meteorological Drought, Hydrological
Drought, Physical Drought and Drought risk Area.
The total area = 170,000 km2
To assess the reliability of resultant map the test areas were check against other information surveyed by The National Economic and Social Development Board (NESDB) or NRD2C survey data. This survey based on the shortage of water in village for agricultural use and domestic consumption. The 26,000 village locations of different water shortage were laid over the drought risk map obtained. Over 80% of village locations of each water deficiency class corresponded to the drought class studied. In addition, information obtained from interviewing the sub-district official committee in relation to result compiled was statistically evaluated and no significantly different. In conclusion, the result obtained by the integration of a number of variables concerned provides guidelines for drought mitigation plan and allocates water for rural consumption. The information offers not only spatial data of drought severity but also their related attributes. These attributes include variables involved the drought, all drought class and villages drought affected. The computer-based information both locational information and attribute data contribute to develop the decision support system with higher accuracy.
5. References
Anukularmphai. A., Shabiruzzaman, and Ullah. E, 1990. Rainfall and evaporation analysis of Thailand. Bangkok, Div. of Agricultural and Food Engineering, AIT.
DEPP., 1996. Flood and Natural Risk Area in Northeast Thailand Project Bangkok; Min. of Science, Technology and Environment.
Koonthanakulwong. S., 1990. Meteorological drought in Northeast Thailand. Bangkok. Chulalongkorn Univ.
NESDB., 1992. The eight National Economic and Social Development Plan, Office of The Prime Minister, Bangkok.
Palmer., 1965. Meteorological Drought, Office of climatology, Washington D.C., U.S. Weather Bureau, Research paper No 45, 58p.
Rig, D.J., 1985. The role of environment in limiting the adoption of new rice technology in Northeast Thailand. Transs. Inst. Br, Geog. N.S.10. p 481-494.
Saenjan. P., Ganier. B.J., Maclean. P.A., 1990. Patterns of Wet Season Rainfall in Northeast Thailand In Proceedings of the Seminar on Remote Sensing and GIS for Soil and Water Management. Khon Kaen : Khon Kaen University, p 180-p 202.
Siripon. K., and Mongkolsawat. C., 2000. Spatial and Temporal Analysis of Rainfall Pattern in Northeastern Thailand : Application of GIS. Journal of Remote Sensing and GIS Association of Thailand. Vol.1, No.1, p.1-p 18.
Wongvitavas.P., 1993. Rainfall Analysis in Northeastern Thailand. Bangkok Meteorological Dept, Technical Document No.551.577.3-01, 99p.
| Drought class | Meteorological Drought (%) | Hydrological Drought (%) | Physical Drought (%) | Drought risk Area (%) |
| Very Mild | 5.61 | 28.12 | 13.40 | 29.40 |
| Mild | 35.20 | 20.22 | 42.78 | 27.34 |
| Modurate | 34.03 | 38.07 | 38.61 | 32.06 |
| Servere | 25.16 | 13.59 | 5.21 | 11.20 |
| Total | 100.00 | 100.00 | 100.00 | 100.00 |
The total area = 170,000 km2
To assess the reliability of resultant map the test areas were check against other information surveyed by The National Economic and Social Development Board (NESDB) or NRD2C survey data. This survey based on the shortage of water in village for agricultural use and domestic consumption. The 26,000 village locations of different water shortage were laid over the drought risk map obtained. Over 80% of village locations of each water deficiency class corresponded to the drought class studied. In addition, information obtained from interviewing the sub-district official committee in relation to result compiled was statistically evaluated and no significantly different. In conclusion, the result obtained by the integration of a number of variables concerned provides guidelines for drought mitigation plan and allocates water for rural consumption. The information offers not only spatial data of drought severity but also their related attributes. These attributes include variables involved the drought, all drought class and villages drought affected. The computer-based information both locational information and attribute data contribute to develop the decision support system with higher accuracy.
5. References
Anukularmphai. A., Shabiruzzaman, and Ullah. E, 1990. Rainfall and evaporation analysis of Thailand. Bangkok, Div. of Agricultural and Food Engineering, AIT.
DEPP., 1996. Flood and Natural Risk Area in Northeast Thailand Project Bangkok; Min. of Science, Technology and Environment.
Koonthanakulwong. S., 1990. Meteorological drought in Northeast Thailand. Bangkok. Chulalongkorn Univ.
NESDB., 1992. The eight National Economic and Social Development Plan, Office of The Prime Minister, Bangkok.
Palmer., 1965. Meteorological Drought, Office of climatology, Washington D.C., U.S. Weather Bureau, Research paper No 45, 58p.
Rig, D.J., 1985. The role of environment in limiting the adoption of new rice technology in Northeast Thailand. Transs. Inst. Br, Geog. N.S.10. p 481-494.
Saenjan. P., Ganier. B.J., Maclean. P.A., 1990. Patterns of Wet Season Rainfall in Northeast Thailand In Proceedings of the Seminar on Remote Sensing and GIS for Soil and Water Management. Khon Kaen : Khon Kaen University, p 180-p 202.
Siripon. K., and Mongkolsawat. C., 2000. Spatial and Temporal Analysis of Rainfall Pattern in Northeastern Thailand : Application of GIS. Journal of Remote Sensing and GIS Association of Thailand. Vol.1, No.1, p.1-p 18.
Wongvitavas.P., 1993. Rainfall Analysis in Northeastern Thailand. Bangkok Meteorological Dept, Technical Document No.551.577.3-01, 99p.