| GISdevelopment.net ---> AARS ---> ACRS 2000 ---> Environment |
Verification Of Surface
Temperature From Landsat 7/Etm+ Data
Yuzo Suga1, Motohide
Yoshimura3, Shoji Takeuchi1 and Yoshinari Oguro2
1: Professor, 2: Assistant Professor and 3: Researcher
Hiroshima Institute of Technology, 2-1-1 Miyake
Saeki-ku, Hiroshima 731-5193, JAPAN
Tel & Fax: +81-82-922-5204
E-mail: ysuga@cc.it-hiroshima.ac.jp
1: Professor, 2: Assistant Professor and 3: Researcher
Hiroshima Institute of Technology, 2-1-1 Miyake
Saeki-ku, Hiroshima 731-5193, JAPAN
Tel & Fax: +81-82-922-5204
E-mail: ysuga@cc.it-hiroshima.ac.jp
Key Words: Surface Temperature, LANDSAT 7/ETM+, Short-wave Infrared, Thermal Infrared
Abstract
The authors conduct a verification study on the surface temperature derived from the short-wave infrared and thermal infrared bands image data of LANDSAT 7 Enhanced Thematic Mapper Plus(ETM+) for the estimation of the thermal condition around the Hiroshima City and Bay Area and the observation of the volcanic activity in Mt. Usu in Japan. As to the thermal infrared band, the approximate functions for converting the spectral radiance into the surface temperature are estimated by considering both typical surface temperatures measured by the simultaneous field survey with the satellite observation and the spectral radiance observed by the ETM+ band 6, and then the estimation of the surface temperature distribution around the Hiroshima City and Bay Area is examined. As to the short-wave infrared band, the detection of the surface thermal anomalies in Mt. Usu is also examined by considering only the surface temperature distribution observed by the ETM+ bands 5 and 7.
1. Introduction
LANDSAT 7 was launched on April 15th, 1999 and images large areas of the sunlit Earth daily by revisiting the same areas every 16 days. It has ETM+ sensor, a multi-spectral scanning radiometer with eight bands and being capable of providing high-resolution image information of the Earth's surface. The ETM+ acquires the image data in visible(band 1: 0.45-0.52, band 2: 0.53-0.61, and band 3: 0.63-0.69µm), near infrared(band 4: 0.78-0.90µm), short-wave infrared(band 5: 1.55-1.75 and band 7: 2.09-2.35µm), thermal infrared(band 6: 10.4-12.5µm), and panchromatic(band 8: 0.52-0.90µm). The spatial resolution is 15m in the panchromatic band, 30m in the visible, near infrared, and short-wave infrared bands, and 60m in the thermal infrared band and each scene represents the Earth in 183 by 170 kilometers.
Hiroshima Institute of Technology(HIT) in Japan has established LANDSAT 7 Ground Station for receiving and processing the ETM+ data on March 15th, 2000. At the beginning of the research, the authors preliminarily examine the verification study on the surface temperature derived from the short-wave infrared and thermal infrared bands image data of the ETM+. The items of the verification study are the estimation of the thermal condition around the Hiroshima City and Bay Area using the ETM+ band 6 image data and the observation of the volcanic activity in Mt. Usu using the ETM+ bands 5 and 7 image data. The surface temperature estimation is necessary to establish the monitoring systems of the heat islands in urban areas, sea surface temperature, thermal drainage distribution, forest fires, and volcanic activities, etc. by using satellite remote sensing, and those systems provide us with the countermeasures for the environmental issues and the prediction methodologies for the natural disasters. So far, many researchers have reported their verification study on the surface temperature from LANDSAT 5/TM and NOAA AVHRR data(Rothery et al. 1988, Rothery et al. 1990, Franca et al. 1994, Schneider et al. 1996, Urai 2000).
2. Test Sites And Data
The test sites for the verification study of the surface temperature from the ETM+ image data are the surroundings of the Hiroshima City and Bay Area and Mt. Usu in Japan. The former is located in the western part of Japan islands and there exists the industrial area along the coast. The latter is located in the northern part of Japan islands and it has erupted on March 31, 2000.
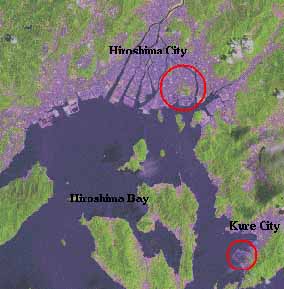
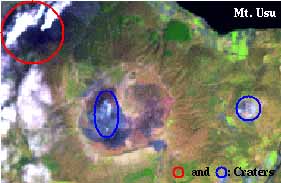
Figure 1: (a) LANDSAT 7/ETM+ color composite images(red : band 5, green : band 4 and blue : band 3) including the surroundings of the Hiroshima City and Bay Area(July 22nd, 2000). (b) LANDSAT 7/ETM+ color composite images(red : band 5, green : band 4 and blue : band 3) including Mt. Usu(May 7th, 2000)
Figure 1(a) and (b) show the LANDSAT 7/ETM+ color composite images(band 5: red, band 4: green, and band 3: blue) received and processed by HIT on July 22nd and May 7th, 2000, respectively. The factories of the automobile manufacture and steel industry are located in the circled area in Figure 1(a). The smokes emitted from new active craters in Mt. Usu are interpreted in left upper corner of Figure 1(b).
3. Surface Temprature From Landsat 7/Etm+ Data
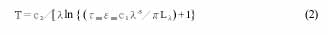
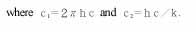
In this paper, the authors conduct a verification study on the surface temperature using the short-wave infrared and thermal infrared bands image data of the ETM+ for the estimation of the thermal condition around the Hiroshima City and Bay Area and the observation of the volcanic activity in Mt. Usu in Japan. For the surface temperature estimation, the radiation emitted from the target on the surface is measured by using the remote sensor such as LANDSAT 5/TM, LANDSAT 7/ETM+, and SPOT 4/HRVIR etc, and Plank's radiation equation can be used to convert the measured spectral radiance to the temperature:

where ? is the wavelength in meters, L? is the spectral radiance in W?m-2?ster-1?µm-1, h is Plank's constant, 6.626×10⁻³⁴Js, k is Boltzmann's constant, 1.380×10⁻²³JK-1, T is temperature in K, c is the speed of light, 2.998×10⁸ms-1, t? is the atmospheric transmittance and e? is the spectral emissivity. Then the conversion equation from the spectral radiance into the temperature can be obtained as follows:
LANDSAT 7/ETM+ data are acquired as the 8 bits gray-scale imagery in Level 1G products. The equation and constants for converting the 8 bits digital number(DN) of the image data into the spectral radiance is as follows:
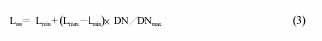
where L? is the spectral radiance in W?m-2?ster-1?µm-1 received by the sensor for the pixel in question. Lmin is the minimum detected spectral radiance for the scene and Lmax is the maximum detected spectral radiance for the scene. DNmax is the maximum value of the gray-level(=255), and DN is the gray-level for the pixel in question. The spectral radiance value is converted from DN in each pixel by using equation (3) and then it can be substituted in equation (2) to compute the temperature.
The satellite level spectral radiance at various temperatures from equation (1) is shown in Figure 3. We can see that the intensity of emitted radiation increases with the peak shifting towards shorter wavelength as the temperature rises. Figure 3 shows that the bands 5 and 7 in the short-wave infrared region can measure the temperature in the range of 250?440? and 160?270?, respectively, and band 6 in the thermal infrared range can measure the temperature in the range of -70?+90? in the low gain mode and -30?+60? in the high gain mode. Parameters such as the wavelength range, Lmax and Lmin, etc. are in Landsat 7 Science Data User Handbook(USGS, 2000).
As to the test site of the Hiroshima City and Bay Area, the authors conduct the simultaneous field survey with the satellite observation and measure typical surface temperatures. By considering the ground truth data measured by the field survey and the spectral radiance converted from the DN data of the ETM+ band 6, approximate functions for converting the spectral radiance into the surface temperature are estimated by the least square method. Then the surface temperature distribution around the Hiroshima City and Bay Area is estimated. As to the test site of Mt. Usu, the authors convert the DN data of the ETM+ bands 5 and 7 into the temperature by using equation (2) and (3), and investigate the distribution of the surface thermal anomalies in Mt. Usu. In this paper, the atmospheric transmittance,t? and spectral emissivity, e? are supposed to be 1.0.
Table 1: The ground truth data measured by the field
survey and the spectral radiance in low and high gain modes observed by
the ETM+ band 6 for each land cover.
| Land cover | Temperature[°C] | Spectral radiance in low gain and high gain modes [W m-2 ster-1 µm-1] | Estimated surface temperature[°C] | |
| Low gain mode | High gain mode | |||
| Sea Surface | 25.1 | 9.0212 | 9.0182 | 25.0 |
| Paddy | 29.8 | 9.0880 | 9.0924 | 27.8 |
| Grass | 35.5 | 9.4221 | 9.4259 | 38.9 |
| Asphalt | 46.1 | 9.6226 | 9.6112 | 44.5 |
| Insulation Material | 66.3 | 10.6249 | 10.6118 | 66.5 |
On July 22nd, 2000, the authors conducted the simultaneous field survey in each land cover using portable thermometers in the Hiroshima City with the satellite observation of LANDSAT 7(path: 112 and row: 36). In order to cover the wide range of the surface temperature, sea surface, paddy fields, grass in golf links, asphalt pavement, and the insulation material on a roof of the building were selected for the field and the satellite observations. Table 1 shows the ground truth data and the spectral radiance from the DN data of the ETM+ band 6. The correlation coefficients between typical surface temperatures and the spectral radiance in Table 1 are 0.989 for the low gain mode and 0.988 for the high gain mode. The approximate functions temperature for low gain and high gain modes for converting the spectral radiance into the surface are estimated as follows:
Llowgain=3.5785e-4×T2?0.1895×T?33.7064 (4)
Lhighgain=3.5625e-4×T2?0.1888×T?33.6634 (5)
where Llowgain and Lhighgain are the spectral radiance in low gain and high gain modes, respectively, and T is the surface temperature in K. The surface temperatures for the five land covers estimated by using above functions are also indicated in Table 1. The result supports the fact that the surface temperature is estimated appropriately. Figure 3 shows the surface temperature distribution in the surroundings of the Hiroshima City and Bay Area derived from the ETM+ band 6 image data. The white colored part depicts the cloud in the image. The temperature distribution in Figure 3 is equivalent to the land cover types and the sea surface temperature distribution is also appropriate in comparison with NOAA/AVHRR data. The high temperatures around 70? observed in the circled area of the Hiroshima City. There exist the large factories of the automobile manufacture. The high temperatures around 80? are also observed in the circled area in the Kure City. There exist the factories of the steel industry. From these results, it is proved the authors can verify the surface temperature derived from LANDSAT 7/ETM+ band 6 image data.
5. Surface temperature in mt. Usu
Mt. Usu begun to erupt again on April 31st, 2000. HIT receives and processes LANDSAT 7/ETM+ data(path: 108 and row:30) on May 7th, 2000. The authors examine the detection of the surface thermal anomalies in Mt. Usu using the image data of the bands 5 and 7 in the short-wave infrared region of the ETM+. Figure 4(a) and (b) show the surface temperature distributions in Mt. Usu derived from the bands 5 and 7 image data, respectively. The surface thermal anomalies are found not only in the new but also in the existing craters. The temperatures around 388? for the band 5 and 245? for the band 7 are found at the new craters in the circled area(red), and the temperatures around 360? for the band5 and 225? for the band 7 are found at the existing craters in the circled area(blue). From these results, it is proved that the authors can verify the surface temperature derived from LANDSAT 7/ETM+ bands 5 and 7 image data.
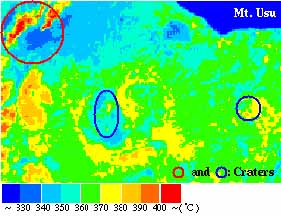
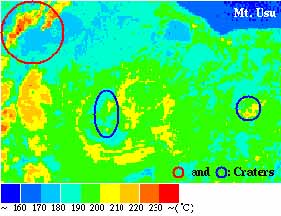
Figure 4: (a) Surface temperature distribution in Mt. Usu derived from the ETM+ band 5 image data. (b) Surface temperature distribution in Mt. Usu derived from the ETM+ band 7 image data.
Conclusion
In this paper, the authors conducted a verification study on the surface temperature derived from LANDSAT 7/ETM+ data using short-wave infrared and thermal infrared bands for the estimation of the thermal condition around the Hiroshima City and Bay Area and the observation of the volcanic activity in Mt. Usu in Japan. The authors estimated the surface temperature distribution equivalent to the land cover types around the Hiroshima City and Bay Area and detect the surface thermal anomalies at craters in Mt. Usu. For the further study, the authors plan the modification of approximate functions for converting the spectral radiance into the surface temperature by the field and satellite observation throughout a year and the development of various monitoring systems for the disaster and environmental issues. In this paper, the atmospheric transmittance and spectral emissivity are supposed to be 1.0. Therefore the effect by the atmospheric transmittance and spectral emissivity should be considered in the further study.
Refferences
Rothery D.A., Francis P.W. and Wood C.A., 1988, Volcano monitoring using short wavelength infrared data from satellites. Journal of Geophysical Research, 93, 7993-8008
Rothery D. A. and Francis P. W., 1990, Short wavelength infrared images for volcano monitoring. International Journal of Remote Sensing, 10, 1665-1667
Franca G.B. and Cracknell A.P., 1994, Retrieval of land and sea surface temperature using NOAA-11 AVHRR data in north-eastern Brazil. International Journal of Remote Sensing, 15, 1695-1712
Schneider K. and Mauser W., 1996, Processing and accuracy of Landsat Thematic Mapper data for lake surface temperature measurements. International Journal of Remote Sensing, 17, 2027-2041
Urai M, 2000, Volcano monitoring with Landsat TM short-wave infrared bands: the 1990-1994 eruption of Unzen Volcano, Japan. International Journal of Remote Sensing, 21, 861-872
USGS, 2000, Landsat 7 Science Data Users Handbook