| GISdevelopment.net ---> AARS ---> ACRS 2000 ---> Environment |
Vegetation Mapping in Ganges
River Basin for Global Mapping Project
Ms. Mona Lacoul, Dr. Lal
Samarakkon and Dr. Kiyoshi Honda
Asian Center for Research on Remote Sensing
Space Technology Applications and Research Program,
Asian Institute of Technology, Km. 42
Paholyothin Highway, Klong Luang, Pathumthani 12120, THAILAND.
Tel : +66-2-524-6148 Fax : +66-2-524-6147
Email : mlacoul@ait.ac.th
Asian Center for Research on Remote Sensing
Space Technology Applications and Research Program,
Asian Institute of Technology, Km. 42
Paholyothin Highway, Klong Luang, Pathumthani 12120, THAILAND.
Tel : +66-2-524-6148 Fax : +66-2-524-6147
Email : mlacoul@ait.ac.th
Abstract (paper -196)
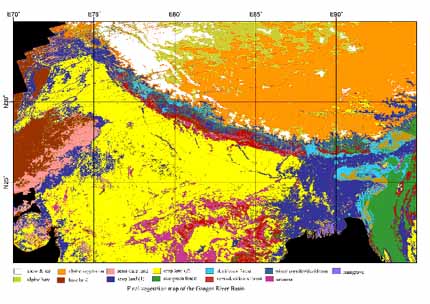
This paper describes the preparation of vegetation map of Ganges river basin that could be used for various hydrological analysis that could be useful for water resources planning, flood forecasting and disaster mitigation. This study focuses on vegetation mapping of the Ganges river basin covering from 70° E to 95° E and 35° N to 20° N using NOAA AVHRR.
Initial vegetation cover of the area was prepared by monthly maximum NDVI data. The reason for aggregate daily NOAA-AVHRR data for monthly average was the presence of considerable amount of cloud cover in this region. Having generated the basic vegetation map based on NDVI, it was further classified according to climatic and elevation zones. The final vegetation map represents vegetation classes that are interpreted considering their temporal climatic and altitudinal variation that are needed to be considered for hydrological analysis.
Introduction
At the United Nations Conference on Environment and Development held in Brazil in 1992, Agenda 21, an action program for addressing global environmental challenges while continuing to support sustainable economic development, was resolved. Agenda 21 clearly makes the case that baseline data on key environmental parameters is important. In this course, in 1992, the Ministry of Construction of Japan began to advocate the Global Mapping concept. The fundamental basis of this concept is to develop global scale geographic information through international cooperation. Since its inception in 1992 the Global Mapping concept has obtained support from many countries in the world. Efforts are now being made to implement the development of global scale map products with uniform accuracy and specification under the auspices of an International Steering Committee for Global Mapping (ISCGM). This will facilitate resolving global problems by forming and implementing policies for the issues such as river control, disaster countermeasure and food security. As continuation of development of global map, Ganges River Basin was selected following the successful completion of Mekong River Area.
The Ganges basin contains the largest river system on the subcontinent. The Ganges rises in the southern Himalayas on the Indian side of the Tibet border. Area covered in the study of global mapping of Ganges river basin(approximately 174000 square kilometer) is 20 N to 35 N latitudes and 75 E to 95 E longitudes. The water supply is dependent partly on the rains brought by the southwesterly monsoon winds from July to October, as well as on the flow from melting Himalayan snows, in the hot season from April to June.
In order to monitor global scale vegetation cover, satellite data with frequent repetitive coverage should be available. This could be achieved only with NOAA-AVHRR series of polar orbiting, meteorological satellites. A lot of research is going on to develop techniques for continental and global scale studies of land cover using AVHRR data. One of such technique is maximum value composting of normalized difference vegetation index (NDVI) for reducing cloud contamination and atmospheric effects. The seasonal variation of NDVI can be used to classify land cover /land use.
Significance of the study
Hydrological analysis, which could provide vital information for water resources planning, flood estimation, desertification analysis etc. requires land cover information as one of the significant parameters or a parameter derived form land cover status. In regional scale studies as in this present study, forest and vegetation cover should be considered with respect to climatic region, elevation condition as vegetation cover in different climatic regions or with the change of elevation could have different characteristics needed to be taken care in hydrological analysis. In order to develop a land cover map satisfying these issues, this study incorporated NOAA-AVHRR data with climatic and elevation information.
Data and Method
NOAA AVHRR maximum NDVI composite
The following flow chart (Fig 1) gives the complete overview of the methodology of analysis of the study.
At first, 10 days composite images of NOAA AVHRR based on maximum normalized difference vegetation index (NDVI) for year 1998 were collected form Asian Institute of Technology. In order to interpret temporal variation pattern, ten days NDVI composites were generated from these data, which is a method accepted globally(Moody & Stranfler, 1994). Due to frequent cloud cover in this region, 10 days temporal resolution of NOAA-AVHRR could not produce cloud-free composites. To overcome this situation, further data aggregation, monthly maximum NDVI was attempted. This step provided cloud free composite for the year 1998 except for the months June, July and August. As these three sense contained significant amount of cloud cover, they were excluded from subsequent analysis.
Multi-temporal NDVI data classification was carried out based on iso-class unsupervised classification method. With few initial evaluation of class distribution it was decided to terminate iso-class groups into 25. The resulting 25 classes were interpreted into vegetation classes using knowledge derived from temporal profiles, elevation, meteorological information as well as existing landuse maps. Basically, the classification scheme developed by International Geographic Information System Examination Committee for Global Mapping was adopted in this stage.
Elevation data
Elevation data freely available from National Imagery Mapping Agency (NIMA) was used for the study. The data is in 30 arc sec, similar to the working pixel NOAA data, but had to transform to the present co-ordinate system.
Meteorological data
10 years meteorological records of Ganges River basin were gathered from different organizations of respective countries. From collected meteorological data, average monthly temperature and average yearly rainfall were calculated for each meteorological station. These data were interpolated incorporating elevation, representing iso heightal lines. These lines were further interpolated to 30 arc sec cells. Similarly, temperature data were interpolated and converted to 30 arc sec cell data.
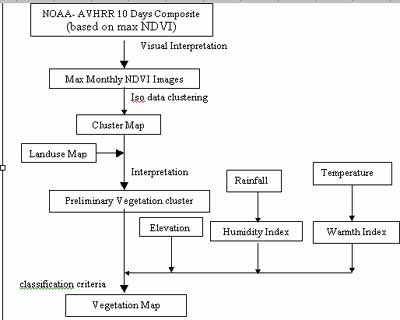
El Fig 1: methodology of analysis
Kira's humidity index and Kira's warmth index were calculated using monthly average precipitation and monthly average rainfall data(Chunying, 1999). These indices are given by following equations. Humidity Index,
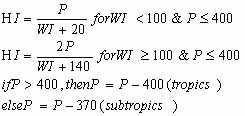
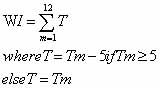
Warmth Index,
P: yearly average precipitation(mm)
Tm : average monthly temperature(C)
Results and Discussion
Studying multi-temporal spectral patterns of each of the 25 clustes, 4 preliminary classes were defined. The classes were (i) snow & ice, (ii) bare land and semi bare land, (iii) crop land and (iv) forest.
Among the 25 clusters, 3 classes were found to be generated with pixels arising from scan error during the data acquisition but the total number of pixels in these classes were less .06% of total pixels. These clasess were excluded from further analysis. The remaining 22 classes were identified as forest(3 classes), semibare land (5 classes), bare land (2 classes), snow &ice (1) and crop land (11 classes). The following figure gives monthly variation NDVI of preliminary classes except for three months June, July, and September.
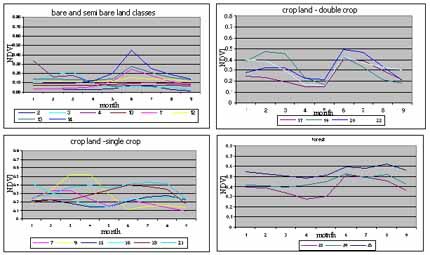
Fig 2: Spectral patterns of different vegetation classes based on Iso-data clustering
The Classes were defined using classification scheme developed by International Geographic Information System Examination Committee for Global Mapping to have conformity with other studies. 11 preliminary classes of crop land in the study area were regrouped into two classes, single crop and double crop based on temporal variance of NDVI.
According to Trwartha&Horn, 1980, approximate altitudinal limit of alpine vegetation on a tropical mountain is above 4000 m elevation. This altitudinal information was used in reclassifying two bare land (2 classes) semi bare land classes (5 classes) into two alpine bare/semi bare land classes and two bare/semi bare land classes.
Elevation and climatic factors were used to classify forest classes into five distinct classes evergreen, deciduous, semi-deciduous, savanna and mixed coniferous - deciduous from three preliminary forest classes. Semi deciduous forest class was interpreted from original forest class referring to annual average precipitation as below 2000m elevation, semi-deciduous forest is predominant (Wallace, 1991). Similarly, other forest classes except mangrove forest were defined from preliminary forest classes using the criteria listed in the following table (table 1). An existing GIS layer of landuse was used to distinguish mangrove forest from other natural vegetation classes.
| Class | Definition | Classification Criteria |
| snow/ice | Perennial snow (snow and ice throughout the year) |
Vegetation index is low(almost constant) |
| alpine desert | Area of more than 4000m elevation covered with snow or ice | Vegetation index is low throughout the year |
| alpine vegetation | Shrubs and broadleaf grass location in the area of more than 4000 m elevation | Vegetation index is low but increases for short time period. |
| bare land | Non vegetated area through out the year | Vegetation index is low (little fluctuation). |
| semi bare land | Almost non vegetated area | Vegetation index is low but increases for short time period. |
| crop (1) | Farming land with two cycles per year | Vegetation index is high twice a year. |
| crop (2) | Farming land with one cycles per year | Vegetation index is high once a year. |
| evergreen forest | Forest of temperate zone in the area of rich rain in summer or throughout the year | Vegetation index is high throughout a year & 85< WI < 180 & HI>10 |
| deciduousforest | Forests active in warm season. | Whose leaves fall in cold season Vegetation index is high but decreases in winter & 45<WI<180 & HI > 7 |
| mixed pine and deciduous forest | Forest mainly locating in mountainous range of Nepal and Bhutan | Vegetation index is high but decreases lower in winter. |
| semi deciduous forest | Forest in tropical low land with precipitation lower than 2000 mm per year (Wallace E. Akin, 1991) | Vegetation index is medium to high. |
| savanna | Grass land in severe dry climate with long dry season consisting of mainly rice family plants with scattered trees | Vegetaion is low to middle throughout a year & WI > 180 & WI > 180 & 5<HI<7. |
Table 1: definition and characteristics of vegetaion classes used in the study
Conclusions
The vegetation map produced in this study following global map guidelines showed conformity and continuity with adjoining data prepared by different study. This provided integration both studies together to develop regional map covering 75 deg E to 110 deg E and 5 deg N to 35 deg N. Visual comparison of result show good relationship with published maps of the all the countries that the area falls and this justifies temporal NOAA-AVHRR data usages in regional scale vegetation mapping.
Acknowledgements
This study was done under the financial support of Infrastructure Development Institute Ministry of Construction, of Japan
References
Moody and Stranhler, 1994. Global data sets for the land from AVHRR. Int. J. Remote Sensing, 1994. Vol 15, no 17, 3473-3491
Defries and Townshend, 1994. NDVI derived land cover classification at global scale. Int. J. Remote Sensing, 1994. Vol 15, no 17, 3467-3486
Ministry of Construction, Infrastructure Development Institute, 1999. Study of comprehensive assessment on infrastructure development using global geographic information system(1). Trail production of the global map in the IndoChina Peninsula and construction of the geographic information system using the global map as a spatial data framework.
Trewartha & Horn, 1980. An Introduction to climate (fifth edition)
Wallace, 1991.Global pattern: climate, vegetation and soils. University of Oklohama Press. Norman. Publishing Division of the University
Chunying, 1999. The Application of Kira's Indices to study of vegetation-climatic interactions in China. ACTA Phytoecologica Sinica. 1999 vol. 2, no 2