| GISdevelopment.net ---> AARS ---> ACRS 2000 ---> Environment |
Land Cover Change And
Fluctuation Of Lacustrine Water Quality In Okutama Lake
Susumu Ogawa* and
,geography, Moriyama**
Faculty of Geo-Environment Science, Rissho University
1700 Magechi, Kumagaya, Saitama, 360-0194 Japan
Phone: +81-48-539-1652 Facsimile: +81-48-539-1632
E-mail: *ogawa@ris.ac.jp; **morimoe77@hotmail.com
Faculty of Geo-Environment Science, Rissho University
1700 Magechi, Kumagaya, Saitama, 360-0194 Japan
Phone: +81-48-539-1652 Facsimile: +81-48-539-1632
E-mail: *ogawa@ris.ac.jp; **morimoe77@hotmail.com
Keywords: forest basins, lacustrine water, water quality, Landsat TM, land cover
Abstract
Land cover change and fluctuation of lacustrine water quality in Okutama Lake were analyzed using two-date Landsat TM data. The relationship between its forest constitution and water quality was investigated. Most land cover was forest in this area. Forest was composed of evergreen and deciduous trees. Two long-term water quality trends were obtained: soil and sewer origins. The former origin might be derived from the change of forest constitution.
1. Introduction
Okutama located in the upper Tama River has been managed for stable flow rate and natural environment by protecting and planting forest. On the other hand, land use change with the management abandonment by aged landowners and the reduction policy of paddy fields affected directly on water quality in the river. The purpose of this study is to examine relationship between land cover change and lacustrine water quality from two-date Landsat TM and water quality data for 39 years in the Ogouchi Dam (Aoyama & Nishikawa, 1990; Kazama, Tada & Sawamoto, 1996; Yamada, Shimizu, Inoue & Tachibana, 1999; Kishimoto, Kakuchi, Somiya & Nakamura, 1999).
2. Materials And Method
2.1 Study Area and Data Used
Study area is located in the upper Tama River in Tokyo and Yamanashi prefectures as shown in Figure 1. For calculation of watershed area and watershed separation, digital elevation models '2,500' and '50m-mesh' by the Geological Survey Institute were used.
2.2 Land Cover Classification
Two-date satellite data were used for land cover classification and each area calculation. With most likelihood method, land cover classification was carried out for 1984 and 1997 as shown in Table 1.
2.3 Watershed Separation
The objective watershed was determined semi-automatically with GIS software from digital elevation models '50m-mesh' by the Geological Survey Institute.
2.4 Water Quality Analysis
Water quality items are water temperature, turbidity, pH, transparency, chlorophyll-a, total nitrogen, and total phosphorus, which were measured at the Ogouchi Dam (Waterworks Bureau, Tokyo Metropolitan Government, 1959-1997). They were analyzed to seasonal and annual changes each item. Moreover, they were calculated for correlation.
3 Results
3.1 Land Cover Change
Table 2 shows land cover classification in the forest of Okutama upper watershed. During the observation, the area of forest and urban increased, while agricultural field decreased as shown in Figure 2. Forest was composed of evergreen and deciduous ones. The latter increased more than the former. Figures 3 and 4 show long-term hydrological observation, which has almost constant trends each variable.
3.2 Water Quality Fluctuation
Figure 5 shows long-term fluctuation for turbidity, transparency, and chlorophyll-a. Transparency and chlorophyll-a increased, while turbidity decreased in trend. In seasonal water quality fluctuation, turbidity and total nitrogen decreased in summer, while chlorophyll-a increased in summer. However, sedimentation increased though turbidity decreased during this period as shown in Figure 6.
3.3 Water Quality Correlation
Table 3 shows correlation between water quality items. Turbidity correlates with total phosphorus positively, but with transparency, chlorophyll-a, and total nitrogen negatively. On the other hand, total nitrogen correlates with water temperature and pH negatively. Chlorophyll-a correlates with transparency, pH, and total inorganic nitrogen (Figure 7) positively. Moreover, sedimentation correlates with the square of flow rate as shown in Figure 8.
4 Discussion
4.1 Land Cover Change
As a result of land cover change, forest and urban area increased, but agricultural fields decreased. The period of satellite data used here corresponds with that of the 8th water supply forest management plan by Tokyo Metropolitan Government from 1986 to 1996. By this plan, the introduction of broadleaf trees into forest led to the change of forest constitution. On the other hand, by the reduction of paddy fields their cultivation area decreased. Moreover, urbanization brought sewer drainage networks to generate sedimentation of soils.
4.2 Water Quality Fluctuation
Long-term fluctuation for water quality in the lake showed two different trends: the decrease of turbidity (increase of transparency) and increase of chlorophyll-a. Turbidity performs transparency reversely, which represents runoff reduction in the watershed physically. On the other hand, the increase of chlorophyll-a means microbial breeding corresponding to the increase of total nitrogen. Moreover, urbanization seemed to make sewer drainage into the lake, which is proved by negative correlation between total nitrogen and rainfall. Rainfall also correlates with total phosphorus, which is inferred from forest runoff.
4.3 Water Quality Correlation
Turbidity correlated with total phosphorus positively, but with transparency, chlorophyll-a, total nitrogen negatively. If turbidity was brought from soils in the watershed, it should depend on rainfall and be affected by the reduction of runoff ratio. In fact, rainfall and turbidity correlated, and the runoff ratio showed decrease trend. On the other hand, total nitrogen showed negative correlation with rainfall. As sewer drainage discharges constantly, it shows negative correlation with rainfall. Therefore, total nitrogen behavior should be derived from sewer drainage. As chlorophyll-a correlates with total phosphorus negatively, its breeding should be controlled by total phosphorus critically. Moreover, chlorophyll-a has positive correlation with total nitrogen annually, but shows negative correlation with it seasonally. It is inferred that chlorophyll-a breeding requires enough total nitrogen supplies and consumes total nitrogen seasonally. Water quality fluctuation in 1984 and 1997 was controlled not only by land cover change but also other factors. For example, vegetation constitution may contribute water quality, which should be the next theme. Sedimentation behavior may depend on sewer networks development, which should be also the next theme.
5 Conclusion
From water quality and satellite data for the Ogouchi Dame for 39 years, relationship between long-term water quality fluctuation and land cover change in the water supply forest watershed was analyzed for the next conclusions.
- Land cover classification indicated the increase of forest and urban area, and the decrease of agricultural fields.
- Long-term water quality fluctuation showed two trends: the decrease of turbidity and the increase of chlorophyll-a and total nitrogen. The former might be affected by the reduction of runoff rate accompanied with the increase of forest and the decrease of agricultural fields. The latter might be caused by sewer drainage pollution into the Tama River accompanied with urbanization.
- From the correlation of water quality items, it was inferred that turbidity was derived from soils with rainfall and chlorophyll-a was controlled by total phosphorus critically to consume total nitrogen.
Acknowledgement
The authors thank Waterworks Bureau in Tokyo Metropolitan Government for their cooperation with their data. We also appreciate to Dr. Genya Saito, Mr. Naoki Ishituka, and Dr. Takuhiko Murakami at National Institute of Agro-Environmental Sciences, and Ms. Ikuyo Makino at Tokyo Institute of Technology for their cooperation of remote sensing analysis.
References
Aoyama, S., H. Nishikawa, and H. Murai, Journal of Remote Sensing Society of Japan, 10, 4, 539-551, 1990.
Kazama, S., T. Tada, and M. Sawamoto, Annual Journal of Hydraulic Engineering, 40, 81-86, 1996.
Yamada, T., T. Shimizu, T. Inoue, and H. Tachibana, Environmental Engineering Research, 36, 217-224, 1999.
Kishimoto, N., K. Kakuchi, I. Somiya, and T. Nakamura, Environmental Engineering Research, 36, 225-236, 1999.
Waterworks Bureau, Tokyo Metropolitan Government, Annual Report of Ogouchi Reservoir Management, 1959-1997.
Table 1 Satellite data used
| Satellite | Date |
| LandsatTM | 1984/10/26; 1997/10/30 |
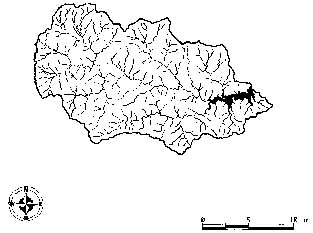
Figure 1 Okutama basin
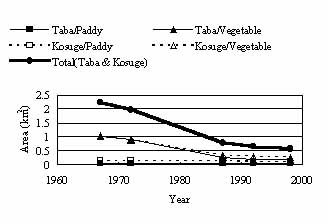
Figure 2 Historical change in agricultural area
Table 2 Land cover area rate in Okutama using Landsat TM (Unit:%)
|
Year |
Forest |
Urban Area |
Grass |
Paddy Field |
Vegetable Field |
Water |
|
1984 |
92.8 |
0.4 |
2.6 |
2.1 |
0.8 |
1.3 |
|
1997 |
97.2 |
1.0 |
0 |
1.0 |
0.5 |
1.3 |
Table 3 Correlation for water quality items
| Items | Turbidity | Transperancy | Chlorophyll-a | Water Temparature | pH | Total Nitrogen | Total Phosphorus |
| Turbidity | 1 | ||||||
| Transperancy | -0.758 | 1 | |||||
| Chlorophyll-a | -0.559 | 0.817 | 1 | ||||
| Water Temparature | 0.051 | 0.085 | -0.023 | 1 | |||
| pH | -0.048 | 0.452 | 0.631 | 0.232 | 1 | ||
| Total Nitrogen | -0.609 | 0.320 | 0.022 | -0.586 | -0.529 | 1 | |
| Total Phosphorus | 0.694 | -0.608 | -0.510 | -0.058 | 0.112 | -0.335 | 1 |
| Rainfall | 0.487 | -0.544 | -0.344 | -0.048 | 0.119 | -0.485 | 0.411 |
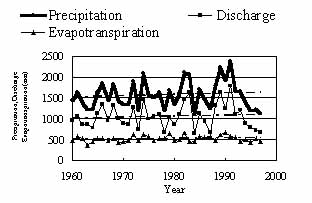
Figure 3 Long-term change in hydrological data
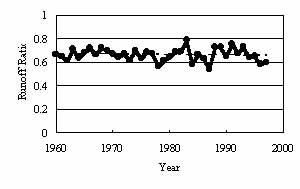
Figure 4 Long-term change in runoff ratio
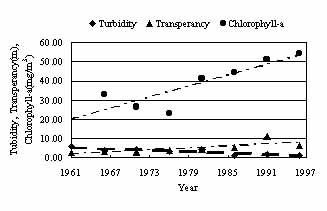
Figure 5 Turbidity, Transparency & Chlorophyll-a
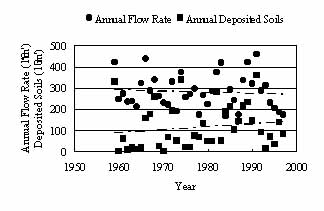
Figure 6 Annual flow rate and sedimentation
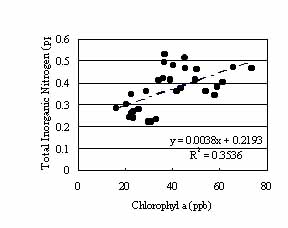
Figure 7 Chlorophyll-a and total inorganic nitrogen
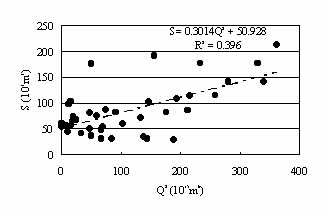
Figure 8 Annual flow rate and sedimentation