| GISdevelopment.net ---> AARS ---> ACRS 2000 ---> Environment |
Surface Temperature Analysis
of Urban Area using RS and GIS
Myung-Hee Jo · Kwang-Jae
Lee · Ji-Hyun Shin · Ae-Sook Suh · Sung-Nam Oh
Department of Geodetic Engineering, Kyungil University
33 Buho-ri, Hayang-up, Kyungsan-si, Kyungsan bukdo, 712-701, Korea
Tel: +82-53-850-7312, Fax) +82-53-854-1272
mhjo@bear.kyungil.ac.kr,mailto:leek-j@hanmail.net,mailto:jh_justina@hanmail.net
Remote Sensing Research Lab·Applied Meteorological Research Lab
MRI, Korea Meteorological Administration
assuh@metri.re.kr,mailto:snoh@metri.re.kr
Key Words : Remote Sensing, Satellite Image, Urban Heat-Island, Surface Temperature, Ndvi
Abstract
The aim of this study is to analyze the relationship between urban surface temperature, land cover and NDVI using satellite image and observation data. This study compared and analyzed between Landsat TM band 6 and AWS data for monitoring the establishment of urban heat island using multi temporal images.
There were several methods to estimate the surface temperature from Landsat TM data. However, in this study, it used four theoretical models to extract thermal density value from Landsat TM band 6 image processing: Two-point linear model, linear regression model, Quadratic regression model and Cubic regression model. After simple analyzing between four models and AWS data, in this case, it should be need selection of suitable model through remodeling of four models. Thus, after remodeling, to created suitable regression algorithm for this study.
In summary, the result of analysis between NDVI, land cover classification and surface temperature will regard as one of effective methodologies for to make manifest urban heat island in the future. This study verified some methods of surface temperature estimating from satellite images and extracted the most effective algorithm through the comparing land cover and surface temperature.
Introduction
These days, a lot of people come together in the city rapidly because of the industrial development, so climatic changes such as a sudden rise in temperature, relative humidity and air pollution have been brought out all over the world. Especially, distinct difference of temperature between urban and rural, it depends on urban planning, construction of industry and pattern of green distribution, which is called urban heat island, is one of the biggest problems nowadays. Furthermore, previous studies only used meteorological observation data of surface although meteorological type was very difference, depending on topographic of study area and landuse. However modern research are using a technique of remote sensing and GIS(Geographic Information System) because it could be possible to prove to adapt these skills in this kind of study area. Park. I. H(1999) did a evaluation of the heat island in transition zone of three cities in Korea. Also, Griend(1993) analyzed distribution of temperature depending on status of surface with correlative analysis between NDVI and surface temperature using NOAA(National Oceanic and Atmospheric Administration) images. According to Klysik and Fortuniak(1999), urban heat island is a phenomenon, which temperature is distinctly going up, because of the increasing buildings in cities.
The purpose of this study is to verify some methods of surface temperature estimating from satellite images and extracted the most effective algorithm through the comparing land cover and surface temperature.
In this research, first of all, surface temperature was taken by Landsat TM band 6 at 25 places in Seoul and the connection of above it is proved through AWS (Automatic Weather Station) temperature data and regression analysis. Then, temporal variation of urban heat island depending on landuse pattern and NDVI(Normalization Difference Vegetation index) was performed. Finally, urban heat island in Seoul could be synthetically analyzed by comparing the distribution of temperature between green areas and non-green areas through GIS spatial analysis.
Materials And Methods Used
In this research, the multi temporal Landsat TM (Apr. 19 1999, Jun. 16.1997, Oct. 22. 1997, Jan. 21 1996) images, temperature data acquired at the point of 23 AWS, 1/5,000 digital map and 1/25,000 topographical map were used to present urban heat islands more precisely. Fig. 1 shows the process of this study.
First, the temperature at every 10 A.M was extracted and classifying each layer using Arc/info GIS Tool prepared the thematic map in study area. Multi temporal Landsat TM(band 5/3/2) images were carried out geometric correction with GCP (Group Control point), which was acquired on 1/25,000 topographical map using Unix ERDAS IMAGINE 8.3.
The training area, which is one of the most important operations in classification, was selected based on "Analyzed distribution of Biotop and construction of ecological city in Seoul city "(Feb. 2000) and Maximum Likelihood Classification classified this area into 10 classes, which is one of supervised classification method.
This research extracted regression equation, which is possible to analyze temperature of study area, through regression analysis between the value of DN(Digital Number) of Landsat TM band 6 and observation temperature of 23 point of AWS for analysis of distribution of temperature at study area.
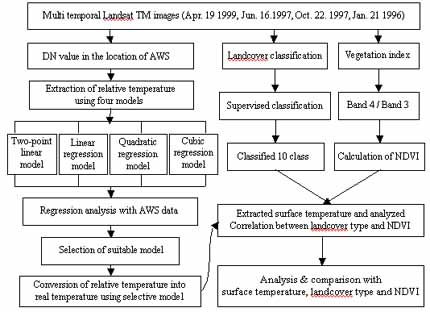
Figure 1. Process of analysis and comparison between heat island, MLC and NDVI
After computing relative temperature using Two-point linear model, linear regression model, Quadratic regression model, cubic regression model, the real temperature was obtained in entire study area through observation temperature and regression analysis. Also, the original vegetation activity has the value of -1 ~ 1. However in this study transformed these value into difference images, which have 8 bit value images.
Analyzing Of Heat-Island Using Landsat Tm Image
1. Analysis of surface temperature using the value of DN of Landsat TM band 6
Observing surface temperature from Landsat TM band 6 and each model was relative temperature. So, it was difference between observation of AWS temperature and relative temperature. However, in this study could extract different regression equation because in this case already operated regression analysis between observation temperature and relative temperature. This study used 4 models, which is already existence, for extraction of real temperature.
Two-point linear model
Temperature(°K) = 203.2 + 0.541176 × TM 6
Linear regression model
Temperature(°K) = 219.97218 + 0.525959 × TM 6
Quadratic regression model
Temperature(°K) = 209.830966 + 0.834313 × TM 6 - 0.001372 × TM 6²
Cubic regression model
Temperature (°K) = 206.127 + 1.054 × TM 6 - 0.003714 × TM 6² + 6.60655 × 10⁻⁶ × TM 6³
However this case need to calculate from the absolute temperature to the centigrade temperature because it had absolute temperature through these equations.
centigrade temperature (?) = absolute temperature (°K) - 273.15
Table 1. Regression equations between real temperature and relative temperature
| YEAR | Suitable Models | Regression Equation | R² |
| Apr. 19. 1999 | Quadratic regression model | Y = 1.2643x - 10.79 | 0.8151 |
|
Jun. 16. 1997 |
Linear regression model | Y = 0.5731x + 14.164 | 0.8640 |
| Oct. 22. 1997 | Quadratic regression model | Y = 1.2439x - 6.7449 | 0.8036 |
| Jan. 21. 1996 | Cubic regression model | Y = 1.1104x - 0.8665 | 0.7683 |
Independent variable: relative temperature
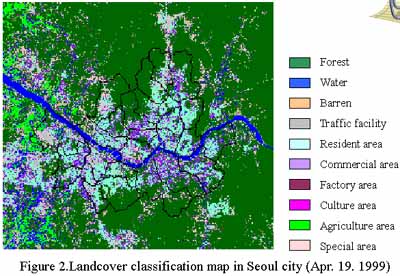
2. Composition of landcover classification map
In this study classified total 10 classes(Forest, Water, Barren, Traffic facility, Resident area, Commercial area, Factory area Culture area Agriculture area, Special area).
3. Extraction of NDVI
This research used the NDVI for to analyze distribution of temperature in green area non-green area. Generally speaking, NDVI have the value of -1(Min) ~ 1(Max) through Equation of NDVI extraction. But, in this case transformed these value into difference images which have 8 bit value images.
NDVI = (Band4 - Band3) / (Band4 + Band 3)
Summary And Conclusions
1. Analyzing distribution of surface temperature with classification type
It can be show as Table 2., which is standard value of surface temperature with classification type using Landsat TM band 6.
| Class | Apr. 19. 1999 | Jun. 16. 1997 | Oct. 22. 1997 | Jan. 21. 1996 |
| Forest | 15.986 | 23.864 | 12.563 | -4.196 |
| Water | 3.759 | 21.634 | 10.528 | 0.43 |
| Barren | 12.088 | 26.451 | 16.834 | 0.887 |
| Agriculture | 13.808 | 24.498 | 14.188 | -0.619 |
| Urban | 20.124 | 28.504 | 16.083 | -1.22 |
| Factory | 19.783 | 30.382 | 17.701 | 0.56 |
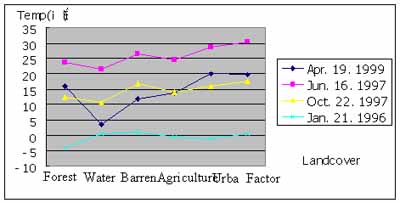
Figure 3. Change detection of temperature with landcover classification
2. Correlation analysis between surface temperature and NDVI using Landsat TM images
This research selected 80 points and calculated Pearson correlation coefficient(R) between surface temperature and NDVI for to study distribution of temperature in green area and non-green area.
| YEAR | Regression Equation | R | R² |
| Apr. 19. 1999 | Y =?6.2073x+214.87 | ?0.8043 | 0.6470 |
| Jun. 16. 1997 | Y =?21.194x+692.25 | ?0.9293 | 0.8636 |
| Oct. 22. 1997 | Y =?14.654x+372.87 | ?0.8414 | 0.7080 |
| Jan. 21. 1996 | Y = 9.14x+135.52 | 0.8490 | 0.7209 |
Reference
- Gallo, K.P et al, 1993, The use of a vegetation index for assessment
of the urban heat island effect, International Journal of Remote
Sensing, 14(11):2223-2230.
- James E. Vogelmann, 1999, Effects of Landsat Thematic Mapper
radiometric and geometric calibrations on selected land cover analyses,
Pecora 14 Proceeding, pp143-153.
- Jensen, 1996, Introductory digital image processing.
- Jauregui, E, 1998, Long-term effect of Mexico City's heat island on
potential energy demand for space heating, Journal of Conference on
Agriclutural and Forest Meteorology, 23rd.
- Kim, H.H, 1992, Urban heat island International Journal of Remote
Sensing, Vol.13 No.12, pp2319-2336.
- Kyung-Hun Park, Sung-Kwan Jung, 1999, Analysis on urban heat island
effects for the metropolitan green space planning, Journal of the Korea
Association of Geographic Information studies, Vol.2 No.3, pp 35-45.
- Lambin, E. F. & Ehrlich D, 1996, The surface
temperature-vegetation index space for land-cover and land-cover change
analysis, Int. J. Remote sensing, 17(3): 463-487.
- Park, Kyung-Hun, Jung, Sung-Kwan, Oh, jung-Hak, Kim, Hee-Nyeon,
Park, Jin-Soo, 1999, Analysis on heat island alleviation effects of
vegetation using Landsat TM data, The Korea Association of Geographic
Information Studies, pp.131-135.
- Park, In-Hwan, Jang, Gab-Sue, Lim, Jong-Yong, 1999, Evaluation of
the heat island in transition zone of three cities in Kyungpook, Korea,
Korea Society Environmental Impact Assessment, Vol. 8 No.2, pp. 73-82.
- Saitoh, T.S, 1998, The present and future state of urban warming in
the Tokyo metropolitan area. Japanese Urban Environment, G.S. Golany et
al, (ed.), Pergamon press, Chapt, Part?-A, pp.99-116.
- Investigation of biotop in Seoul and establishment of guide for construction of ecology city, 2000, Seoul.