| GISdevelopment.net ---> AARS ---> ACRS 2000 ---> Environment |
Capability Of Radarsat Data
In Monsoon Flood Monitoring
Mardiana Shafiee, Azman
Ahmad and Osman Kadir
Malaysian Centre For Remote Sensing (MACRES)
13, Jalan Tun Ismail
50480 Kuala Lumpur, Malaysia
Tel: 603 - 2697 3400 Fax: 603 - 2697 3350
Website:http:\\www.macres.gov.my
Malaysian Centre For Remote Sensing (MACRES)
13, Jalan Tun Ismail
50480 Kuala Lumpur, Malaysia
Tel: 603 - 2697 3400 Fax: 603 - 2697 3350
Website:http:\\www.macres.gov.my
Abstract
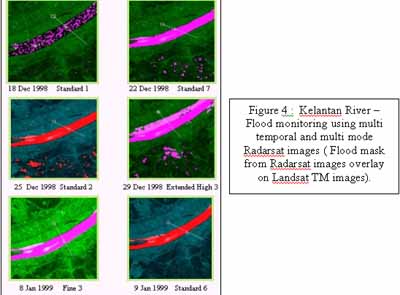
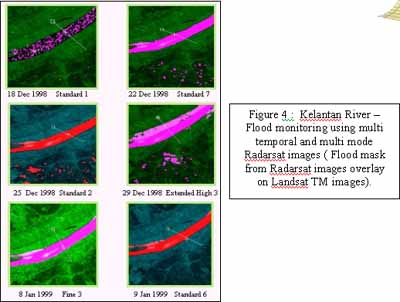
Flood is one of the disaster which distructing of properties and human life. In Peninsular Malaysia, flood often occurred during monsoon period in November and December. During flood event, most of the area covered by cloud and sometime light rain. In this situation, radar sensor was used and is able to penetrate in any type of wheather. These studies investigate the capability of radar using Radarsat data to monitor and mapping the flood event in Kota Baharu, Kelantan. Six scenes of multi temporal (18 Dec 1998, 22 Dec 1998, 25 Dec 1998, 29 Dec 1998, 8 Jan 1999 and 9 Jan 1999) various mode (standard, extended high and fine) of Radarsat data, acquired during flood event and Landsat-5 TM data (29 August 1997) captured during dry session were used. Radar image processing and analysis including special filters were tested. The Radarsat images were combined with Landsat-5 TM and produce the window profile to confirm the flood area. Vector of flood area extracted from the radar images overlay on the Landsat-5 TM to produce the flood mapping. Result indicated that Radarsat images applied with special filter performed better result. It shown better assessment on the movement of flood event. Conclusion from this study, Radarsat images have potential and capable monitoring the flood event and easy to identify the flood area from the flood mapping.
1.0 Introduction
Monsoon floods occur every year in Malaysia during the monsoon, in particularly in the East Coast of Peninsular Malaysia. Information about flood is extremely important as it helps mitigation planning and support activities in both state and national level (Mardiana, et al. 1999). Satellite images has been a useful source of information all this while. In flood studies applications, remote sensing can be used to map extend of flooding, assess flood damages and effect of flood mitigation infrastructure on flood plain hydrology, determine the changes of hydrological regimes in the flood plains and evaluate flood prediction techniques. The optical imaging sensors used in those platforms rely on the sun ray has caused feasible due to the presence of thick and widespread cloud.
To overcome this major setback, the uses of active remote sensing are developed. Such system has the ability to penetrate clouds, strong contrast observed on images between land and water surface areas and its frequent revisit capabilities makes it particularly useful data in monitoring and detecting flood in the region such as Southeast Asia (Honda et. al. 1997).
2.0 Study Area
Kota Bharu is located in the east coast of Peninsular Malaysia. It is under the administrative jurisdiction of Kelantan state government. Map of the study are shown in Figure1.0.
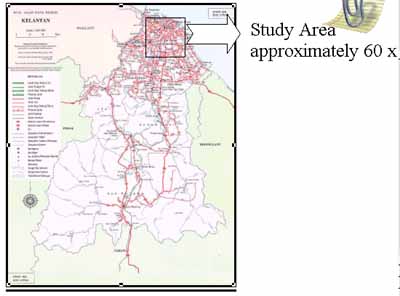
Figure 1.0 Location of the Study Area
3.0 Materials
Our approach for this research involved the use of multi-sensor and multi-temporal satellite data for monitoring monsoon flood in the study area. For the purpose, both VIR and SAR data were utilized in combination with a GIS database. Landsat TM data were selected as VIR data while Radarsat data were selected as SAR data.
3. 1 Satellite Data
Descriptions of all the data sources for this study are summarized in the table 1.0 below.
| Satellite Data | Date of Acquistion | Ground Resolution (m) | Wavelength (mm) | Incident Angle |
| Landsat TM | 29 August 1997 | 30 | 0.45 - 12.5 | 94° |
| Radarsat Standard 1 | 18 December 1998 | 12.5 | C-band | 20° - 49° |
| Radarsat Standard 7 | 22 December 1998 | 12.5 | C-band | 20° - 49° |
| Radarsat Standard 2 | 25 December 1998 | 12.5 | C-band | 20° - 49° |
| Radarsat Extended High 3 | 29 December 1998 | 12.5 | C-band | 50° - 60° |
| Radarsat Fine 3 | 8 January 1999 | 6.5 | C-band | 37° - 48° |
| Radarsat Standard 6 | 9 January 1999 | 12.5 | C-band |
20° - 49°
|
4.0 Methodology
Both visual and digital image analysis methodologies were employed during the investigation of the remotely sensed data giving greater emphasis for this study. Flowchart of the study shown as figure 2 below .
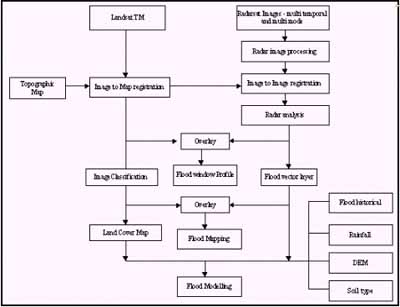
Figure 2 : Flowchart of flood study
4.1 Visual Image Analysis
Visual Image analysis of the entire data source was done primarily for orientation and familiarization with the recognizable features of the study area. The knowledge gained from the procedure was instrumental in the subsequent selection of the training samples for the digital image analysis. Geometric correction and image registration of all data sources were performed before visual analysis.
4.2 Filtering
The best filter is selected based on theoretic all facts that which filter produced an image with lowest standard deviation and mean value compared with original image value. Besides that, the filtered images also judged by visual interpretation. From the observation, Kuan filter are found to be the most suitable filter to be used in this project because it provides the lowest standard deviation value and high visual interpretation compare to others. As a conclusion, the Kuan Filter with 3x3 mask are selected, this is because filter with 5x5 could blur the images visually.
4.3 Geometric correction
Two types of geometric correction was done in this study : (i) Image to map registration, (ii) Image to Image registration.
4.3.1 Image to Map registration
The Landsat TM scene was first spatially geo-referenced to a UTM map projection using the second order polynomial and resampled with a cubic convolution algorithm. Ground control points (GCPs), are located and then were identified from 1:50,000 scale topographic maps. A total of 74 GCP point were collected and the points are well distributed and well defined on the image. A root mean square (RMS) error of less than quarter pixel (0.25) was accepted for the correction process. The image is then resample by converting 30 m pixel size to 12.5 m. The geometrically corrected Landsat TM images were crosschecked with the topographic map to optimize accuracy.
4.3. 2 Image to Image registration
Multi temporal and multi mode radarsat images are geometrically corrected using image to image method with validated geocoded Landsat TM image used as a referenced for the registration of other radarsat images. This method consist collecting ground control point pairs from a split-screen display of both the uncorrected and master images. The master file can be any image file that the analyst wishes to regard as a standard, whether or not it has been previously corrected. The root mean square value is set to be less than one pixel. These images are then resampled using cubic convolution algorithm with second order polynomial.
5.0 Data analysis and results
There are two types of analysis method were done in this project : (i) Visual Image Analysis, and (ii) Digital Image Analysis.
5.1 Visual Image Analysis
Visual image interpretation was done by overlaying single date Radarsat image to Landsat TM . From the process of overlaying, it reveals that the spot of water and the size of the Kelantan river and Tumpat District varies differently according to the date. The significant increase shows the presence of flood in the particular area at figure 3 and figure 4.
5.2 Digital Image Analysis
Multi-temporal Radarsat data were analyzed by displaying the window profile. As we can see on the profile segment for six multi temporal images and multi mode, we could detect the increases and decreases of water level according to the distances. For example, the Radarsat image dated 22nd December 1998 shows a distance 410 meter and 950 meter for the training area Kelantan river/Kota Bahru and Tumpat District. For the same area, Radarsat image dated 29th December 1998 however shows an increase of water level. The distance for Kelantan River was 625 meter while Tumpat District 1.26 km. However, the water level shows reduction in the Fine image dated 8th January 1999 where reading in the area in Kelantan river are 430 meter while 950 meter in Tumpat district (see figure 4). Counting the pixel of the training area in Tumpat District (see figure 5) by masking the vector of predicted flood area, a typical wet area to be found expanding in these three images. The first image (22nd of December 1998) was around 35.5 km². In the second image (29th of December 1998) shows a tremendous increase to 119.7 km². This area anyway, reduces to a figure of 79 km² in the third image (8th of January 1999). These increase/decrease volume of water can be verify by the ground truth data which was gathered by the Department of Irrigation And Drainage (DID) on the study area between the date 29th of December 1998 till 5th January 1999 which flood have been occured during this period.
6.0 Conclusion
Discrimination of flood area can be significantly predicted both visually and statistically using multi-temporal and multi mode of Radarsat images on flood mapping (see figure 3). Radarsat images have potential and capable monitoring the flood event and easy to identify the flood area from the flood mapping. Further research will carried out to integrate with spatial database to obtain a better result of flood mapping and flood modelling.
Reference
Mardiana, S., Azman, A., and Osman, K. (1999) ,"Remote Sensing In Flood Studies", Presented at Seminar on Remote Sensing & Related Technologies for Water Resources, 27 September 1999, Kuching Sarawak.
Honda, K., Canisius, F.X.J., Sah, B.P. (1997) , " Flood Monitoring in Central Plane of Thailand Using JERS-1 SAR data" Proceedings of the 18th Asian Conference on Remote sensing, 20-24 October 1997, Kuala Lumpur.
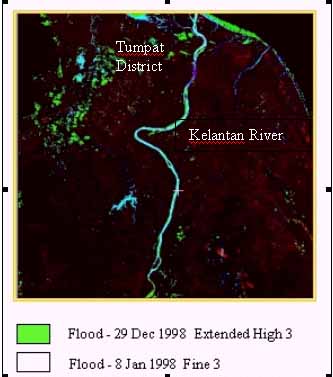
Figure 3 : Flood mapping - Kota Baharu, Kelantan