| GISdevelopment.net ---> AARS ---> ACRS 2000 ---> Environment |
Estimation of the methane
emission from west Siberian wetland by Scaling between NOAA/AVHRR and
SPOT/HRV data
Wataru Takeuchi* Masayuki
Tamura** Yoshifumi Yasuoka*
*Institute of Industrial Science, University of Tokyo
4-6-1, Komaba, Meguro, Tokyo 153-8505, Japan
Tel & Fax: +81-3-5452-6410
**National Institute for Environmental Studies
16-2, Onogawa, Tsukuba, Ibaraki 305-0053, Japan
Tel: +81-298-50-2479, Fax: +81-298-50-2572
Keywords:
remote sensing, spatial resolution, scaling technique, methane emission
*Institute of Industrial Science, University of Tokyo
4-6-1, Komaba, Meguro, Tokyo 153-8505, Japan
Tel & Fax: +81-3-5452-6410
**National Institute for Environmental Studies
16-2, Onogawa, Tsukuba, Ibaraki 305-0053, Japan
Tel: +81-298-50-2479, Fax: +81-298-50-2572
Abstract
High spatial resolution data is effective for monitoring the land cover type changes, but it can't cover a wide area because of its narrow width. On the other hand, global scale details indispensable due to the low spatial resolution. It is necessary to devise a method for the fusion of the data with different spatial resolutions for monitoring the scale-differed phenomena.
In this paper, firstly, we developed a scaling technique to extrapolate the local information on landcover type combination from high spatial resolution data (SPOT/HRV) to more extensive area through low spatial resolution data with wide coverage (NOAA/AVHRR). Over a combined set of HRV and AVHRR data, landcover type of the area was classified into 4 categories with the corresponding category mixture ratio from HRV pixels for corresponding AVHRR pixel. With this regression model (scaling model), local information of the category mixture was extrapolated to extensive area with AVHRR data.
Secondly, this method is applied to the wetland categorization by means of the regression analysis (scaling model) relating AVHRR CCT counts in ch.1.2 and 3 with HRV ch. 1.2 and 3. Then we estimated the methane emission in the west Siberian wetlands by using the methane flux for each land cover type.
1. Introduction
Westen Siberian wetlands are presumed to be large sources of methane (CH4), which is one of the most important greenhouse gases. In this research, we investigate the land cover conditions in western Siberian wetlands by using remote sensing techniques and estimate wide area methane emission in wide area by combining the results of satellite observation with ground methane measurements.
We used two types of sattelite sensors: SPOT/HRV as a high spatial resolution sensor and NOAA/AVHRR as a low spatial resolution sensor. High spatial resolution data is used for detailed classification of the land cover types in the test site. Global scale data is used to monitor the whole western Siberian wetland (Fig.1).
The objective of this study are to develop the method for the fusion of the data with different spatial resolution for monitoring the scale-differed phenomena and to examine the relation between ground surface conditions and the greenhouse gases.
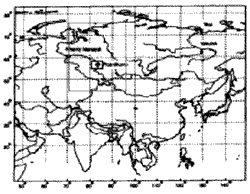
Figure 1 : Location of Western Siberian Wetland
2. Comparison of Vegetation Index between AVHRR and HRV
SPOT/HRV data of July 7th, 1995 and NOAA/AVHRR data of July 7th, 1995 over Plotnikovo in western Siberian wetland were geometrically corrected and overlayed so that one pixel of AVHRR covers a set of HRV pixels in a rectangular block of 50x 124 (Fig. 2). Spatial resolution of one pixel of AVHRR is around 1.1 (km) and that of HRV is around 20(m). Then the relations between each pixel of AVHRR and corresponding block of 55 x 55 pixels of HRV were statistically investigated in NDVI (normalized Difference Vegetation Index). NDVI for AVHRR and HRV are defined by
NDVIAVHRR = (AV2-AV1)/(AV2 +AV1) (1)
NDVIHRV = (HRV3-HRV2)/(HRV3 +HRV2) (2)
Where AV1, AV2, HRV2 and HRV3 are the CCT counts for NOAA/AVHRR ch.1 and 2, and SPOT/HRV ch.2 and 3 respectively, Fig. 2 and 3 shows the NDVI from NOAA/AVHRR and SPOT/HRV data over the target area. The relation between NDVI value for each AVHRR pixel and an average NDVI value for a corresponding HRV block 50x 124 is examined (Fig. 4). Regression analysis between NDVIAVHRR and NDVIHRV shows high correlation between the vegetation index of NOAA/AVHRR and SPOT/HRV (r=0.93).
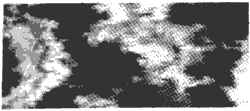
Figure 2: AVHRR/NDVI (50x 124 pixels)
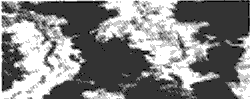
Figure 3: HRV/NDVI (2750 x 6820 pixels)
3. Estimation of category mixing ratio of AVHRR from HRV Data
Scaling model between NOAA/AVHRR and SPOT/HRV was investigated to estimate the mixing ratio of landcover cateogies in each pixel data. With this model, local information from SPOT/HRV data was extrapolated to the whole western Siberian wetland through AVHRR data.
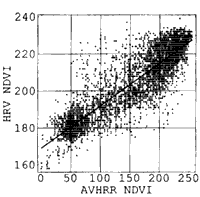
Figure 4: Scatter plot between AVHRR/NDVI and HRV/NDVI
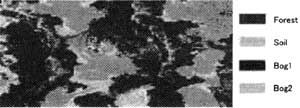
Figure 5 : Land cover classification from SPOT/HRV data
First, each pixel of HRV was classified into 4 categories including forest, soil, bogl and bog2 by using supervised classification (fig.5). The mixing ratio in each pixel of AVHRR data is calculated by counting the land cover type in each block of 55x55 pixels of HRV.
Then, AVHRR channel 1,2 and 3 were correlated with F,S, B1 and B2, which are the coverage ratios for each category mixing ratio of forest, soil bog1 and bog2, using least squares method. The linear equations obtained with high correlation are Eq. 3,4,5.
AV1 = 34.7F+60.0S+23.8B1+29.2B2, r2=0.63 (3)
AV2 = 111F+132S+145B1+173B2, r2=0.87 (4)
AV3 = 87.0F+96.7S+42.3B1+55.7B2, r2=0.62 (5)
This relation shows that the category mixing ratio (F,S, B1,B2) can be solved inversely from Eq. 3,4,5 and the following constraint Eqn. 6.
F + S + B1 + B2 = 1 (6)
This scaling model enables us to extrapolate the local information (category mixing ratio) from SPOT/HRV to more extensive area by NOAA/AVHRR data.
4. Extrapolation of the results for an extensive area
By applying the model equations 3,4,5 and 6, we estimated the category mixing ratio F,S,B1 and B2 for more extensive area through AVHRR data. Figure (6), (7), (8) and (9) shows each category mixing ratio image.
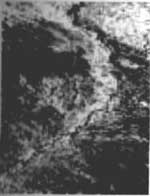 Figure 6: Forest |
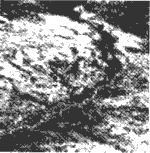 Figure7: Soil |
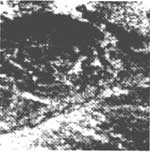 Figure 8: Bog1 |
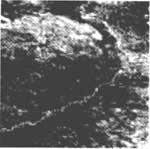 Figure 9: Bog2 |
5. Estimation of methane emission from the broader wetland
We calculated the methane emission by multiplying the emission rate area size for each land cover type. The emission rate for forest and soil are zero because it is reported that they do not release much methane. Table 1 shows the mixing ratio, methane emission rate for each landcover type and the methane flux.
| Landcover Type | Area (103km2) | Emission rate(mg/m2/day) | Methane flux(109g/day) |
| Forest Soil Bog1 Bog2 |
113.0 75.2 79.2 35.1 |
0 0 118 166 |
0 0 93.5 58.3 |
| Total | 302.5 | - | 151.8 |
6. Summary
This study demonstrated that scaling techniques would provide a tool to extrapolate local information from high spatial resolution data to larger scale by using low spatial resolution data. We applied this method, to the wetaland categorization by means of the regression analysis then estimated the methane emission in the west Siberian wetlands.
Since most of the global issues originate from local such as extensive logging, monitoring earth surface changes requires that the observation of landcover embraces the terrain from local to global. Linking local with global is one of the key aspects in global environmental issues. The method proposed in this study is expected to play an important role in bridging the local and the global in remote sensing.
References
- Y.Yamagata, et al.. 1997L Development of Vegetation-Soil-Water Index algorithms and applications, Journal of Remote Sensing, Vol.17(1), pp.54-63 (in Japanese)
- M. Sugita and Y.Yasuoka, 2000: Estimation of Land Cover Mixing Ratio within a Pixel by Scaling between NOAA/AVHRR and LANDSAT/TM Data, Journal of Remote Sensing, Vol. 20(1), pp.32-42 (in Japanese)
- K.Minami,et al., 1994: Soil and Atmosphere, pp.55-84 (in Japanese)