| GISdevelopment.net ---> AARS ---> ACRS 2000 ---> Educational & Profession |
Development of data set for
analysis of landsat tm images Using www browser and spreadsheet
Kiyotada
SATO
*Ichinoseki National College of Technology
Takanashi,Hagisyo,Ichinoseki-shi,Iwate
021-8511,JAPAN
Tel:(81)-191-24-4738 Fax: (81) -191-24-2146
E-mail:satok@ichinoseki.ac.jp
Ryuzo YOKOYAMA
Ueda 4-3-5,Morioka,Iwate
020-8511,JAPAN
Tel:(81)-19-621-6478 Fax: (81) -19-621-1170
E-mail:Yokoyama@cis.iwate-u.ac.jp
Keywords: Remote sensing education, WWW browser, Spreadsheet, VBA macros
Abstract:
We have developed a data set for education of Landsat TM images using WWW browser and spreadsheet. The data set includes images for display and CSV numerical data for calculation. The CSV data are calculated using Microsoft EXCEL spreadsheet. The result can be displayed as a thematic map with VBA macros. All of the data set has created automatically using UNIX shell.
1. Introduction
Recently, variety satellite imageries and digital maps have been available. However, those data are not necessarily used actively for education purpose. One of the reasons, there is no adequate data set and calculation techniques using personal computer. Therefore we developed a data set for education of remote sensing image analysis. The data set includes image and numerical data of TM, topographical map and vegetation map. The images are displayed with WWW browser online or offline. Some of the images are converted to Comma-Separated Values (CSV) numerical format data. The CSV data are calculated with Microsoft EXCEL spreadsheet. The result of the calculation can be displayed as a thematic map using Microsoft EXCEL Visual Basic for Applications (VBA) macros developed by us.
The data set require preliminary operation skills of a WWW browser and a spreadsheet. In the near future, the skills will be taught at any school. The data set using WWW browser and spreadsheet will be appropriate style for remote sensing education.
2. Image Data And Its Display
2.1 Image data
All images in the data set are made in JPEG format for full color display by any WWW browser. The images are geometrically corrected and projected by UTM and 30m resolution (Iikura, 1998). There are 17 images, those are
1) Landsat TM images:
Band 1,2,3,4,5 and 7 images
Natural colored image (Band 3=Red, 2=Green, 1=Blue)
Pseudo colored image (Band 4= Red, 5=Green, 6=Blue)
2) Topographical maps:
Digital elevation model (DEM)
Slope angle map calculated by DEM
Aspect angle map calculated by DEM
Sunlight incidence angle map calculated by above data and incidence and zenith angle 1:50000 geographical map
3) Vegetation maps:
Vegetation map edited by Japan Environmental Agency
Land cover map made from above vegetation map
Automatic classification land cover map
In the vegetation maps, The land cover map (7-merged vegetation map) is made from the vegetation map which merge into grass, conifer leaf forest, broadleaf forest, paddy, town, water and unclassified. The automatic classification land cover map (ACAI) is made from cluster image by ISODATA unsupervised classification to get maximum value of a classification accuracy (Sato, 1999). We suppose the map shows detailed land covers.
2.2 Link structure of the images
There are three types of the image size for browsing. We call those images "Layer1", "Layer2" and "Layer3". Fig.1 shows link structure of the images.
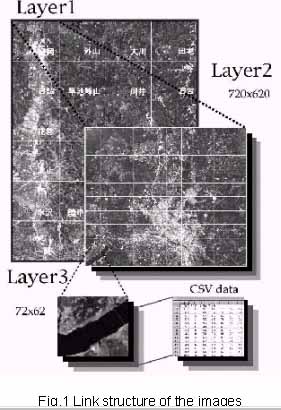
There are 17 Layer2 images in the data set. The image size of the Layer2 is 720x620 pixel. The size and location coincide with 1:50000 geographical map issued by the Geographical Survey Institute of Japan. Each of Layer2 images is divided into 10x10 grid for assignment Layer3 image using WWW browser. The size of Layer3 images is 72x62 pixel. The images are icons for WWW browser. A selection of the image will start of loading the corresponding CVS data.
The Layer2 and Layer3 images have statistics data, minimum, maximum, mean and standard deviation. The Layer3 statistics data are displayed besides the images as Figure.2.
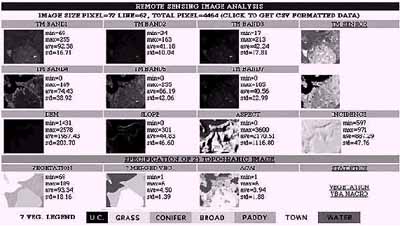
Fig.2 Layer3 images using WWW browser
3. CSV Data And Its Calculation
3.1 Numerical value of the data set
There are two types of the CSV data. Those are
- 1 byte length integer
- TM band 1,2,3,4,5 and 7
- Vegetation map,7-merged vegetation map and Automatic classification land cover map
- 2 bytes length integer (multiplied by 10)
- DEM with 0.1m resolution
- Slope angle map, Aspect angle map, Sunlight incidence angle map with 0.1degree resolution
- These CSV data will be read by Microsoft EXCEL automatically, and displayed the numerical values on the spreadsheet if the WWW browser setup so.
3.2 VBA macros
The CVS data on the spreadsheet will display
or calculate using Microsoft EXCEL. The result of the calculation can be
displayed as a thematic map using VBA macros. Table1 shows the VBA macro
names and their operations.
Table 1 VBA macro operation for image
display
| Macro Name | Operation Name |
| Shift right | Insert two columns at left side of Layer3 data |
| Legend Set | Setup two values and paint color for conditional formatting |
Development of data set for
analysis of landsat tm images Using www browser and spreadsheet
| Conditional formatting of cell colors | |
| Minimum Size | Reduction image size to minimum of cells |
| Recover Size | Normal cell size recover |
| Half Size | Reduction image size to half of normal |
| Shift Left | Delete setup values and colors area |
In order to display of thematic map, macros sequence as follows.
- The CVS data on the spreadsheet will be right shifted by execution of "Shift right" macro.
- "Legend set" macro will setup legend colors and initial values, minimum, average and maximum value of the CVS data. These initial values and legend colors can change.
- "Paint" macro will color paint to the CVS data area according to the setup values. The macro will be colored quickly by conditional formatting operation. If setup values are outside of the CVS data, the cell color will be white.
- "Minimum size" macro will show a reduction size image. Fig.3 shows an example of the minimum size image display.
- "Recover size" macro will recover cell size at the loading CSV data, and "Half size" macro will display at half size of the image.

Fig.3 Image display by VBA macro function
4. Create Of The Data Set
The data set is created automatically using a UNIX shell command. The command readout data from the geometrical corrected 4350 x 6800 pixel image of TM, topographical maps and vegetation maps. All of the images are converted to JPEG format, all of the texts are written by HTML format. All of the Layer2 images are drawn grid line. Then make a hundred subdirectories to save of Layer3 data. Each of the Layer3 subdirectory includes 16 images, 13 CSV data, and some text files. All of a Layer2 data set will creates less then 25 minutes using the HP 9000/C240.
5. Conclusion
We developed data sets of useful for remote sensing education. The data set has been using at a college and others. However, the data set does not assist a guide of elementary knowledge for remote sensing. An explanation of this guide is necessary for practical use of the data set. Internet WWW browser and Microsoft EXCEL have been utilized by many people. In order to promote of remote sensing education, the tools can not ignore. This paper showed useful data set using the tools.
References
Iikura, Y., Yokoyama, Y., 1998, Ortho-rectification of Landsat TM imagery and its evaluation. Journal of the Japan Society of Photogrammetry and Remote Sensing, Vol.37, No.4, pp. 12-22
Sato, K., Iikura, Y. and Yokoyama, R., 1999,Automatic category assignment of satellite images using vegetation map. Journal of Remote Sensing Society of Japan, Vol.19 No.4,pp. 40-48