| GISdevelopment.net ---> AARS ---> ACRS 2000 ---> Digital Photogrammetry |
Implementation of Digital
Photogrammetry for monitoring The Tsaolin Area in Taiwan
Jihn-Fa JAN
(Taiwan)
Assistant Professor, Department of Geography
National Changhua University of Education
1, Jinn Der Road, Changhua 500, Taiwan
Telephone: +886-4-7232105 ext. 2825 Facsimile: +886-4-7211186
E-mail: jfjan@cc.ncue.edu.tw
Jih-Cheng RU (Taiwan)
Director
Agricultural and Forestry Aerial Survey Institute
No. 61-3, Chao-Chou Street, Taipei 106, Taiwan
Telephone: +886-2-23931837 Facsimile: +886-2-23931870
E-mail: nn240918@ms19.hinet.net
Yeong-Kuan CHEN (Taiwan)
Professor, Department of Forestry
National Taiwan University
1, Sec. 4, Roosevelt Road, Taipei 106, Taiwan
Telephone: +886-2-23630231 ext. 3134
Facsimile: +886-2-23639799
E-mail: ykchen@ccms.ntu.edu.tw
Key WordsAssistant Professor, Department of Geography
National Changhua University of Education
1, Jinn Der Road, Changhua 500, Taiwan
Telephone: +886-4-7232105 ext. 2825 Facsimile: +886-4-7211186
E-mail: jfjan@cc.ncue.edu.tw
Jih-Cheng RU (Taiwan)
Director
Agricultural and Forestry Aerial Survey Institute
No. 61-3, Chao-Chou Street, Taipei 106, Taiwan
Telephone: +886-2-23931837 Facsimile: +886-2-23931870
E-mail: nn240918@ms19.hinet.net
Yeong-Kuan CHEN (Taiwan)
Professor, Department of Forestry
National Taiwan University
1, Sec. 4, Roosevelt Road, Taipei 106, Taiwan
Telephone: +886-2-23630231 ext. 3134
Facsimile: +886-2-23639799
E-mail: ykchen@ccms.ntu.edu.tw
digital photogrammetry, GIS, digital terrain model.
Abstract
On 21 September 1999, an earthquake of 7.3 on the Richter scale shook the Tsaolin area and caused an enormous landslide. Accompanying the quake, a large natural dam was formed by the fallen rocks and debris. Due to the fragile geological structure in this area, effective measures are needed to prevent devastating floods caused by collapse of the dam. The objective of this research was to apply digital photogrammetry to monitor the Tsaolin area so as to provide valuable information for flood prevention, water resource planning, and hydraulic engineering. In this research, aerial photographs obtained after the earthquake were used to investigate the geomorphic status in the study area. The aerial photographs were converted to digital images using high-resolution scanning device. Using the digital images, the digital photogrammetric technique was applied to collect digital terrain model (DTM) grids and other topographic features of the study area. Furthermore, from the digital terrain models, GIS was applied to derive stream networks, watersheds, aspect, slope, curvature, profile curvature, planform curvature, and several physiographic parameters for this area. The results indicate that, digital photogrammetry is an effective approach for monitoring geomorphic status of a large area. In addition, the digital terrain model generated by digital photogrammetry can be readily applied to produce topographic and geomorphic data that are valuable for various disciplines.
1. Introduction
In the past few decades, there were three large landslides in the Tsaolin Area, Yunlin County, Taiwan. On 21 September 1999, an earthquake of 7.3 on the Richter scale shook the area and caused another landslide. Accompanying the quake, a large natural dam was formed by the fallen rocks and debris. Due to the fragile geological structure in this area, effective measures are needed to prevent devastating floods caused by collapse of the dam. Any treatment on the area should be based on accurate estimate of the volume of the dam, amount of water, and flow path. However, the road condition and instability of the slope makes surveying the area very difficult and costly.
Photogrammetry has the advantages of acquiring information about a large area very efficiently and cost effectively. Especially for inaccessible areas, photogrammetry is far more superior than traditional ground survey. In recent years, inexpensive computers and advance of computer technologies contributed to the rapid development of digital photogrammetry (Dowman et al., 1992; Heipke, 1995). Successful implementation of digital photogrammetric workstation in mapping have been found in various disciplines (Chen et al., 1998; Skalet et al., 1992). In this research, aerial photographs obtained after the earthquake were used to investigate the geomorphic status in the study area. The aerial photographs were converted to digital images using high-resolution scanning device. Using the digital images, the digital photogrammetric technique was applied to collect digital terrain model (DTM) grids and other topographic features of the study area. The objective of this research was to apply digital photogrammetry to monitor the Tsaolin area so as to provide valuable information for flood prevention, water resource planning, and hydraulic engineering.
2. Materials and Methods
2.1 Study area
As shown in Figure 1, the study area, Tsaolin, is located in the Gukon Township of Yunlin County. This area is the upstream region of the Chinsuei Creek, and the elevation ranges between 280 m and 1400 m.
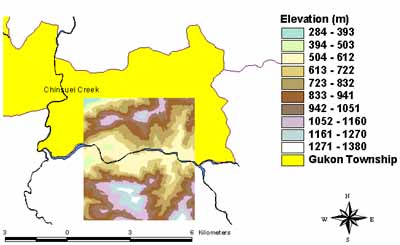
Figure 1. Location map of the study area.
2.2 Materials
A set of aerial photographs of the study area was acquired on December 24, 1999. The aerial camera used was a RMK A TOP 15/23 manufactured by Carl Zeiss. The average flight height was 3,000 meters above mean ground elevation, which yielded 1:19,000-1:21,000 for the scale of the photographs. For these photographs, the percentage of forward overlap and side overlap were about 80% and 30%, respectively. The hardware and software used in the study included Zeiss C-130 analytical stereoplotter, digital photogrammetric workstation (Intergraph ImageStation), aerial photograph scanner, personal computers, ArcInfo, ArcView GIS, and MicroStation.
2.3 Analysis methods
In order to obtain high-quality mapping products, standard photogrammetric procedure was followed to acquire aerial photographs and process the related data. Figure 2 depicts the workflow of digital photogrammetric processing. In somewhat more detail these steps are described as follows.
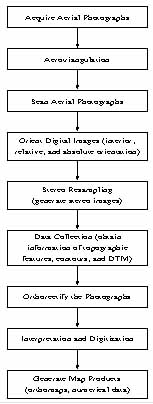
Figure 2. Workflow of digital photogrammetric processing.
For each photograph comprising the stereo models, the control points including ground points of known horizontal position and/or elevation, and natural targets discernible on the photographs were identified. These points were then carefully measured using C-130 analytical stereoplotter. Triangulation was done using PAT-M local adjustment software.
In order to retain as much detail of the original film as possible, high-quality positive films were used to duplicate them. The duplicated positive films were then scanned using Intergraph Photo Scan system. The resolution used in the scanning process was 15 µm, or approximately 1,700 dots per inch.
The orientation process includes three steps, that is, interior orientation, relative orientation, and absolute orientation. Interior orientation reconstructs the bundle of light rays so that they are geometrically identical to those entered the camera lens at the time of exposure. Relative orientation reproduces the same perspective conditions between a pair of photographs so that the corresponding light rays in these two photographs intercept in space and a stereo model is formed. Follows relative orientation, the process of absolute orientation involves using control points with known horizontal and/or vertical positions to make the stereo model conform in scale and position with respect to the reference plane of the map sheet. At the completion of absolute orientation, the position of any point in the stereo model can be measured at the intersection of two corresponding light rays (American Society of Photogrammetry, 1980). The orientation process was completed using the mensuration software (ISDM) module provided by Intergraph ImageStation.
After completing the orientation process, the original imageries were resampled to generate epipolar images, which were used to form the stereo model. The images were viewed in stereo on the monitor using the CrystalEyes stereo viewing system. While viewing the images in stereo, topographic features of interest such as streams, contour lines, spot heights, and DTM (digital terrain model) grids were collected. The DTM were then used to orthorectify the photographs to produce orthophotos.
Together with other reference data, the images and collected topographic features were analyzed and special features were digitized as needed. The final products of the digital photogrammetric process include orthophotomaps and numerical data (e.g. contour lines, DTM), which may be readily used to build a geographic database for use in GIS (geographic information system).
3. Results
Control points are needed to scale and level the stereo model resulting from relative orientation. For each photograph used in the photogrammetric process, several natural targets distributed evenly over the photograph were identified. Together with existing known ground control points and control points obtained from control survey, all the points were carefully measured using Zeiss C-130 analytical stereoplotter. These points were then used as input to the PAT-M software, which was used to perform aerotriangulation. The scale of the maps to be produced was set to 1:5,000. Consequently, aerotriangulation was performed following the mapping standard.
The photographs were scanned at a resolution of 15 µm. The digital images were compressed to about 150 MB in order to reduce the required storage space. In addition, to facilitate rapid display of the images, overviews of the original images were created. These images were then used for orientation. The control points required for absolute orientation were obtained from aerotriangulation. To insure satisfactory orientation results, by repeatedly examining the results for possible errors the orientation process completed only if the error was less than 15µm, i.e. no more than a pixel.
After completion of orientation process, stereo images were generated by resampling the original images. While viewing the stereo images in stereo, topographic features including contour lines, spot heights, peaks, and drains were digitized. These topographic features were then used to build a TIN (triangulated irregular network) model. In addition, a GRID model, similar to DTM, was produced from the TIN model. To attain accurate illustration of the relief of the study area, the vertices of contour lines were sampled at 5-meter interval. The pixel size of the GRID model was set to 9 m x 9 m. This pixel size was selected because high quality orthophotomaps can be achieved using the existing map setting system. The GRID model, or DTM, was then used to orthorectify the photographs. Figure 3 shows the shaded relief and an image created by draping orthophoto image on top of the relief.
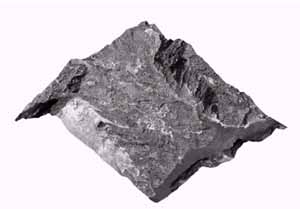
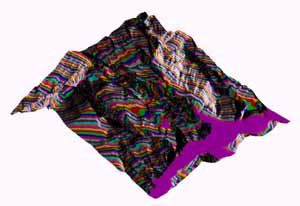
Figure 3. Shaded relief and orthophoto image draped over the relief.
The topographic features and DTM can be used for further analysis by using GIS software. Using the software developed by Jan et al. (2000), several physiographic parameters of the study area such as watersheds, stream networks, stream orders, stream lengths, drainage density, mean elevation, median elevation, bifurcation ratio, streams lengths ratio, stream areas ratio, and stream frequency can be readily derived from the DTM.
4. Discussion
In this study, the aerial photographs were obtained about three months after the earthquake. By examining the photographs, it is apparent that the landscape of the study area has been changed drastically. To understand the impacts of earthquake on the environment, and the risks resulted from the natural dam on the surrounding villages, a large-scale surveying about the area is very needed. This study shows that photogrammetry is very suitable for acquiring information about a large area, particularly when cost, effectiveness, efficiency, and accuracy are all considered.
The digital photogrammetric approach utilizes digital images to do all the measuring and digitizing works, therefore it is essential to have high-quality digital images. Extra caution should be exercised to retain appropriate contrast of the images both during the processes of duplicating film and scanning.
The accuracy of the photogrammetric mapping process highly depend on the accuracy of control points, equipment used for measurement, and most importantly, well-trained people that execute the tasks. To insure satisfactory results, ground survey is necessary to obtain data for the control points. In addition, the results of aerotriangulation provides the basis for model adjustment and further measuring tasks, therefore the aerotriangulation process has to be done carefully.
To estimate the volume of the natural dam and the amount of water, it requires data about the geomorphic status of the study area prior to the earthquake. Therefore, the photographs obtained before the earthquake can be used for photogrammetric processing. Further study is suggested to monitor the geomorphic changes in the study area in order to prevent disaster from occurring in the future.
5. Conclusion
The following conclusions are drawn from this study:
- Aerial photogrammetry is an effective approach for acquiring information about a large area, particularly when cost, effectiveness, efficiency, and accuracy are all considered. In addition, the results produced using digital photogrammetric approach can be readily used to establish geographic database, which can be further analyzed with GIS software. Integrated with GIS, digital photogrammetric approach can provide timely and accurate information about an area, which may be valuable for various disciplines.
- High-quality digital images are required for use in digital photogrammetric processing. Therefore, the processes of duplicating film and scanning positives should be done with extra caution.
- The results of aerotriangulation provide the basis for model adjustment and further measuring tasks, therefore the aerotriangulation process has to be done carefully. When necessary, ground survey should be done to acquire data about the control points.
- Further study is suggested to monitor the geomorphic changes of the study area. It is recommended to acquire aerial photographs both prior and after the earthquake in order to monitor temporal changes in this area. Considering the cost and time constraint, as well as the desirable accuracy of the data generated from the mapping process, digital photogrammetric approach and GIS may be most suitable to meet the objective.
Reference
- American Society of Photogrammetry, 1980. Manual of Photogrammetry. Eds. Slama, C.C., C. Theurer, and S.W. Henriksen, American Society of Photogrammetry, VA, 1056 p.
- Chen, Y.K., J.F. Jan, and H.Y. Lai, 1998. Mapping and establishing topographic layers for GIS in mountainous forest area by digital photogrammetric technique. Quart. Journ. Exp. For. National Taiwan University, 12 (3), pp. 139-156. [in Chinese with English summary]
- Dowman, I.J., H. Ebner, and C. Heipke, 1992. Overview of European developments in digital photogrammetric workstations. Photogrammetric Engineering and Remote Sensing, 58 (1), pp. 51-56.
- Heipke, C., 1995. State-of-the-Art of digital photogrammetric workstations for topographic applications. Photogrammetric Engineering and Remote Sensing, 61 (1), pp. 49-56.
- Jan, J.F., Y.K. Chen, C.C. Cheng, H.Y. Lai, and S.C. Liaw, 2000. Automatic extraction of watershed physiographic parameters using digital terrain model and geographic information system. Proceedings of The 19th Symposium on Surveying Research and Applications, August 24-25, Changhua, Taiwan, pp. 455-464.
- Skalet, C.D., Y.G. Lee, and L.J. Ladner, 1992. Implementation of softcopy photogrammetric workstations at the U.S. Geological Survey. Photogrammetric Engineering and Remote Sensing, 58 (1), pp. 57-64.