| GISdevelopment.net ---> AARS ---> ACRS 2000 ---> Digital Photogrammetry |
Orthorectification of Stereo
Spot Panchromatic and Radarsat Fine Mode Data using Orbital Parameters and
Digital Elevation Model
Mohd Ibrahim Seeni Mohd and
Shahruddin Ahmad
Department of Remote Sensing
Faculty of Geoinformation Science and Engineering
Universiti Teknologi Malaysia
81310 Skudai Johor, Malaysia
Tel: (607) 5502906 Fax: (607) 5566163
E-mail: mism@fksg.utm.my , sahmad@fksg.utm.my
AbstractDepartment of Remote Sensing
Faculty of Geoinformation Science and Engineering
Universiti Teknologi Malaysia
81310 Skudai Johor, Malaysia
Tel: (607) 5502906 Fax: (607) 5566163
E-mail: mism@fksg.utm.my , sahmad@fksg.utm.my
Rectification of satellite data using ground control points (GCPs) in a polynomial fit is not practical in areas where well-defined GCPs are limited. This will be the case in many forested areas or in coastal areas. Rectification using orbital parameters of the satellite together with limited GCPs will overcome this problem. This study emphasises on the evaluation of the geometric accuracy of SPOT Panchromatic and Radarsat Fine Mode data using the later technique. The GCPs were obtained by differential Global Positioning System technique with sub-meter accuracy. The accuracy of rectification evaluated using independent check points gave a positional accuracy of 0.4 pixels for SPOT Panchromatic data. The rectification reveals that the optimum number of GCPs is 8 for SPOT Panchromatic data and 10 GCPs for Radarsat Fine Mode data. A digital elevation model derived by digital image matching technique from stereo SPOT Panchromatic and Radarsat Standard Mode data was used to remove relief distortion to produce an orthoimage. The digital elevation model (DEM) accuracy was validated using spot heights derived from contour map in flat and hilly areas. The accuracy of DEM achieved from stereo SPOT data is 26.3 m and stereo Radarsat data is 35.2 m. The final orthoimage of SPOT Panchromatic and Radarsat Fine Mode data was quantitatively evaluated by merging with digital vector data of 1:25,000 scale of the area. The mismatch in details between them is about ±1 pixel.
Keywords
Rectification, Orbital Parameters, Digital Elevation Model, SPOT, Radarsat Satellite Data.
1. Introduction
Rectification of satellite image by polynomial method is widely used since it is simple. However, this method is not practical in areas where GCPs are very limited and also in images where the elevation ranges from flat to hilly areas. The use of orbital parameters can overcome this problem.
Various studies have been carried out using satellite orbital parameters for the rectification of SPOT Panchromatic (Cheng & Toutin, 1997 and Westin, 1990) and ERS SAR data (Cheng and Toutin, 1997 and Keong, 1995). The results from these studies showed an accuracy of 0.3 pixel from SPOT data and 1 to 2 pixels for ERS SAR data. In the case of stereo SPOT, an accuracy of 10 m can be achieved (Al-Rousan et al., 1997 and Theodossiou & Dowman, 1990). Toutin (1998) also showed that stereo Radarsat data can produce DEM from various pair of modes and intersection angles with an accuracy of 25 m.
In this study, orbital parameters have been used with limited GCPs to carry out geometrical correction of SPOT Panchromatic and Radarsat Fine Mode SAR data together with DEM generated from the stereo SPOT data and stereo Radarsat Standard Mode SAR data.
2. Study Area and Satellite Data
2.1 Study area
The test site that has been selected for this study is the Klang Valley area, Malaysia, which covers an area of 60 km by 60 km (Figure 1). The selection of this site is due to the topography which ranges from flat, moderate and hilly areas.
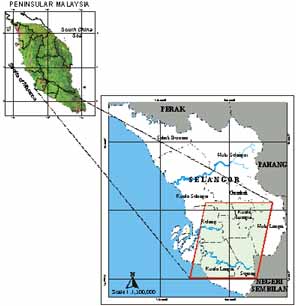
Figure 1: Study area.
2.2 Satellite Data
The characteristics of the satellite data used in this study is given in Table 1. The base height ratio (B/H) value for SPOT stereo pair is 0.8. The value of vertical parallax ratio (VPR) calculated for the Radarsat stereo pair data acquired from the same side of Standard 2 and Standard 7 mode is 0.99.
| Platform | SPOT | RADARSAT | |||
| Scene Number | 270-344 | 269-343 | 14297 | C0015070 | C0015059 |
| Sensor/ Mode | HRV-P | HRV-P | F5F-Mode | Standard Mode (S2) | Standard Mode (S7) |
| Level of Processing | 1 A | 1 A | Path Image | Path Image | Path Image |
| Date | 21.4.98 | 23.1.98 | 31.7.98 | 20.12.99 | 17.12.99 |
| Pixel Size (meter) | 10x10 | 10x10 | 6.25x6.25 | 12.5x12.5 | 12.5x12.5 |
| Viewing Angle (degree) | -30.3 | +15.8 | 45.5 | 24 | 45 |
3. Data Processing
3.1 Data Collection
GCPs of high accuracy are necessary for rectification of SPOT Panchromatic and Radarsat Fine Mode data due to the high spatial accuracy of the data. For this reason, GCPs collection was carried out using GPS real time differential correction technique. The observations were done using a 12-channel Omni STAR receiver with sub-meter accuracy. A total of 35 GCPs that are uniformly distributed over the image were obtained. In addition, digitised contours from a topographic map with scale of 1:25,000 at 20 m interval are used to validate the DEM that has been generated. Major roads were also digitised to evaluate qualitatively the final orthoimage.
3.2 Geometric Modeling
In this study, the rectification process using PCI/OrthoEngine Version 6.3.0 software is based on collinearity conditions which represent the transformation between the image and ground space. This technique was developed by Toutin (1995) from the Canada Center for Remote Sensing (CCRS). The input for the model are orbital parameters gathered from header file and image coordinates (pixel, line) which correspond to the coordinates (X, Y, Z) of the Malaysian Rectified Skew Orthomorphic (RSO) projection.
The left-hand SPOT Panchromatic and Radarsat Standard Mode images were rectified. The rectified image is transformed and resampled to create epipolar geometry to ensure both images are offset only in the horizontal direction. Image matching was performed to match the corresponding pixel in the right image, i.e a template window and moving this template window in the search area of the epipolar image until the best digital number match is obtained. The correlation coefficient between 0 and 1 is calculated for each pixel, where 0 represents a total mismatch and 1 represents a perfect match. The different center locations of template window with the matched pixel represents the parallax. This parallax value is used to compute the elevation at the center of the template.
4. Rectification Results
4.1 SPOT Panchromatic Data
The rectification accuracy of scene 270-344 is 0.28 pixels (x direction) and 0.27 pixels (y direction) using all 35 GCPs. In order to find an optimum number of GCPs for the rectification, the following number of points were tested, i.e 4, 6, 8, 10 and 12 points. A few GCPs were also used as check points to evaluate the accuracy of rectification. Table 2 and Figure 3 show the results of the RMSE of GCPs and check points. The accuracy is almost constant when the number of GCPs used is about 8 and more with a corresponding accuracy of 0.4 pixels at check points. Using 4 GCPs, the accuracy of rectification is 1.36 pixel.
| Ground Control Points | Check Points | |||||||
| No. of GCPs | RMSE (pixels) | No. of CPs | RMSE (pixels) | |||||
| X | Y | R | X | Y | R | |||
| 4 | 0.28 | 0.08 | 0.29 | 31 | 1.32 | 0.29 | 1.36 | |
| 6 | 0.33 | 0.19 | 0.38 | 29 | 1.08 | 0.3 | 1.13 | |
| 8 | 0.27 | 0.21 | 0.34 | 27 | 0.34 | 0.3 | 0.45 | |
| 10 | 0.25 | 0.22 | 0.33 | 25 | 0.32 | 0.3 | 0.44 | |
| 12 | 0.24 | 0.21 | 0.32 | 23 | 0.32 | 0.29 | 0.43 | |
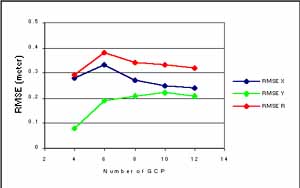 Figure 3: RMSE plot of rectification for SPOT data. |
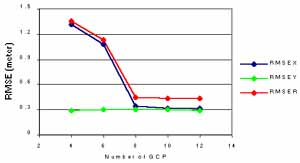 Figure 4: RMSE plot of check points for SPOT data. |
4.2 Radarsat Fine Mode Data
GCPs selection for Radarsat Fine Mode rectification is more difficult compared to SPOT due to the speckle. Speckle reduction was performed using Lee and Frost filters in order to enhance the image details for accurate GCPs selection. The rectification of the Radarsat data was carried out by using only 12 GCPs since the other GCPs were not clear on the image. As a result, evaluation of accuracy could not be performed. However, evaluation of accuracy was done after the process of orthorectification. The rectification result shows that the RMSE is 9.06 pixels using 4 GCPs and improves with increase in the number of GCPs. It is possible to obtained RMSE of ±1 pixel with 12 GCPs.
Table 3: RMSE of rectification for
Radarsat data.
|
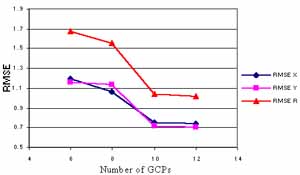 Figure 5: RMSE plot of rectification for Radarsat data. | |||||||||||||||||||||||||||
5. Accuracy of DEM
From Table 4, it can be seen that different accuracies have been achieved from DEM generated from stereo SPOT and stereo Radarsat data. Accuracy of both DEMs was validated in flat/moderate and hilly terrain using check points derived from contours. The flat/moderate area mainly covers urban area and vegetation, whilst most of the hilly area is covered by tropical rain forest. The accuracy of flat/moderate area from SPOT DEM is 32.1 m and for hilly area is 17 m which was evaluated using 100 check points. For the Radarsat DEM the accuracy achieved in flat/moderate areas is 41 m and 26.7 m in hilly area. The results show that both DEMs give better accuracy in hilly area compared to flat/moderate area. The overall accuracy of SPOT DEM is 26.3 m and Radarsat DEM is 35.2 m. This result shows that accuracy of SPOT DEM is better than Radarsat DEM. The difference in accuracy is due to the better spatial resolution of SPOT Panchromatic compared to Radarsat Standard Mode data.
Table 4: Comparison of RMSE of DEMs
for different types of terrain.
|
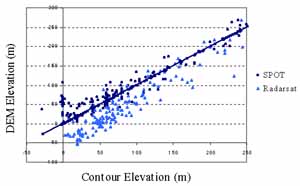 Figure 6: Comparison of accuracy of SPOT and Radarsat DEMs. |
6. Orthorectification
Orthorectification is a process to remove the relief distortion using DEM to produce an orthoimage. In areas with cloud cover and homogenous pixels (eg. forest), the SPOT DEM produced 'missing' elevation values. These areas are masked and the corresponding elevations in these areas were replaced by using the elevation from Radarsat DEM. The DEM obtained by combining the SPOT and Radarsat data were used to produce the orthoimage. The accuracy of orthoimage was evaluated by superimposing with digitized digital vector data of the study area. The mismatch in the location of roads and rivers are about 1 pixel (Figures 7 and 8).
7. Summary
The method of rectification using orbital parameters is suitable for areas with limited GCPs. This study shows that the rectification using SPOT Panchromatic data gives an accuracy better than 1/3 pixel, whilst Radarsat data give an accuracy of about 1 pixel. The optimum number of GCPs required for suitable rectification of SPOT Panchromatic data is 8 and Radarsat Fine Mode SAR data is 10. The DEM generated from stereo SPOT Panchromatic data gives an accuracy of 26.3 m and Radarsat Standard Mode data is 35.2 m. The accuracy in the DEM is satisfactory to remove relief distortion to produce an orthoimage with good accuracy for mapping.
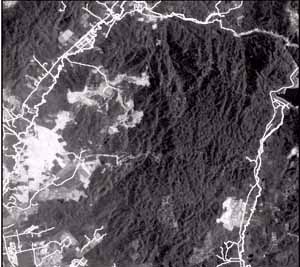 Figure 7: Orthoimage of SPOT Panchromatic data. |
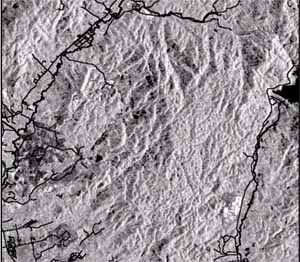 Figure 8: Orthoimage of Radarsat Fine Mode SAR data. |
References
- Al-Rousan, N., Cheng. P., Toutin. T. and Valadan Zoel, M.J., (1997). "Automated DEM Extraction from SPOT Level 1B Imagery". Photogrammetric Engineering & Remote Sensing, Vol. 63, No. 8, August, pp 965-974.
- Cheng, P. and Toutin.T., (1997). "On-Site Interactive GPS and Geometric Modelling: A Winning Combination". EOM, April 1997, pp. 35-37.
- Keong, K.L., (1995). "Geocoding of Spaceborne SAR Imagery". Proceedings of Seminar on the Integration of Remote Sensing and GIS for Applications in South East Asia, 27-29 March 1995, Kuala Lumpur, Malaysia.
- Theodossiou, E.I. and Dowman, I.J, (1990). "Heighting Accuracy of SPOT". Photogrammetric Engineering & Remote Sensing, Vol. 56, No.12, December, pp. 1643-1649.
- Toutin, T., (1995). "Multi-Source Data Fusion with an Integrated and Unified Geometric Modelling". Journal EARSel - Advances in Remote Sensing, Vol.4, No 2, pp. 118-129.
- Toutin, T., (1998). "Stereo RADARSAT for Mapping Applications. Proceedings of ADRO Final Symposium, Montreal, Canada, October 13-15, 1998.
- Westin, T., (1990). "Precision Rectification of SPOT Imagery". Photogrammetric Engineering and Remote Sensing, Vol. 56, No. 2, February, pp. 247-253.