| GISdevelopment.net ---> AARS ---> ACRS 2000 ---> Digital Photogrammetry |
Global Image Composite of
ADEOS/OCTS GAC Data
T.Hashimoto1,
T.Igarashi2, A.Mukaida3,
R.Higuchi3
1Center for Environmental Remote Sensing (CEReS), Chiba University,
1-33 Yayoi-cho, Inage-ku, Chiba 263-8522, Japan
Tel:+81-43-290-3842, Fax:+81-43-290-3857,
Email: hashi@ceres.cr.chiba-u.ac.jp
2Earth Observation Research Center, National Space Development of Japan,
1-9-9 Roppongi, Minato-ku, Tokyo 106-0032, Japan
3Remote Sensing Technology of Japan,
1-9-9 Roppongi, Minato-ku, Tokyo 106-0032, Japan
Key
Words1Center for Environmental Remote Sensing (CEReS), Chiba University,
1-33 Yayoi-cho, Inage-ku, Chiba 263-8522, Japan
Tel:+81-43-290-3842, Fax:+81-43-290-3857,
Email: hashi@ceres.cr.chiba-u.ac.jp
2Earth Observation Research Center, National Space Development of Japan,
1-9-9 Roppongi, Minato-ku, Tokyo 106-0032, Japan
3Remote Sensing Technology of Japan,
1-9-9 Roppongi, Minato-ku, Tokyo 106-0032, Japan
Image Composite, ADEOS/OCTS, Geometric Correction
Abstract
The OCTS(Ocean Color and Temperature Scanner) onboard the ADEOS(Advanced Earth Observing Satellite) was the first space borne optical scanner with many channels. It observed mainly the ocean condition, but the data could be used for land monitoring. In case of utilizing optical sensor data for land monitoring, cloud free composite images are very useful. The authors generated the cloud free composite images of OCTS GAC(Global Area Coverage) data for the applications to the land environment. The cloud free composite images from NOAA/AVHRR data are very popular in such applications. Since the characteristics of OCTS are different from those of the AVHRR, the different method is necessary for generating the composite images from the OCTS data. The paper describes the method of generating the image composite of OCTS data and introduces the product as the result.
1. Introduction
The ADEOS was launched in 1996 by NASDA (National Space Development Agency of Japan). Unfortunately it was terminated 10 months after the launch. The OCTS onboard the ADEOS is an optical mechanical scanner with 12 channels covering visible to thermal infrared region. The orbit of ADEOS satellite is summarized in Table 1 and the main characteristics of the OCTS are shown in Table 2. The GAC data are generated by re-sampling the data with original spatial resolution to the data with ground resolution of about 3.5 kilometers at nadir.
| Item | Value |
| Type | sun synchronous, sub-recurrent |
| Period | 101 min. |
| Inclination | 98.6 deg. |
| recurrent period | 41 days |
| Local time at descending node | AM.10:30±15min |
| Item | Value |
| Spectral Channels | VIS : 6, NIR : 2, TIR : 4 |
| Resolution at Nadir | 680 m |
| Swath Angle | ± 40 deg. |
| Tilt Angle | -20 deg., 0 deg., 20 deg. |
| Quantization Bits | 10 bits/data |
The geometric accuracy is very important in the field of land applications like multi-temporal analysis, image composite, etc. The initial checks of ADEOS data indicated that the geometric accuracy of the OCTS imagery was more than 10 kilometers on the ground. The NASDA and some organizations examined the factors for such terrible errors and found out three factors; 1) the bug of the software for determining satellite position, 2) the insufficiency of the algorithm for getting satellite attitude, 3) the miss-alignments of the sensors. Among them, the first factor was easy to fix. With respect to the second one, a new algorithm adapted to the ADEOS-II satellite has been examined. The third one was corrected using a number of ground control points (GCP) from many OCTS images. The modification of processing system at the ground station lead to the geometric accuracy of the OCTS imagery within a few kilometers which correspond to more than one pixel in the GAC data. But, the accuracy was yet insufficient. The system for precise geometric correction had to be developed.
The Maximum Value Composite (MVC) method utilizing the Normalized Difference Vegetation Index (NDVI) is very popular to generate cloud free composite images from NOAA/AVHRR data (NOAA, 1997). The OCTS was operated with two kinds of gain mode; ocean mode and land mode. The image composites from the OCTS data in the land mode were generated by the MVC as same as the AVHRR data. In case of the ocean mode, however, the NDVI could not be calculated, because some pixels of near infrared channels were saturated. Another method had to be applied to the image composite from the OCTS images in the ocean mode.
2. Method for Image Composite
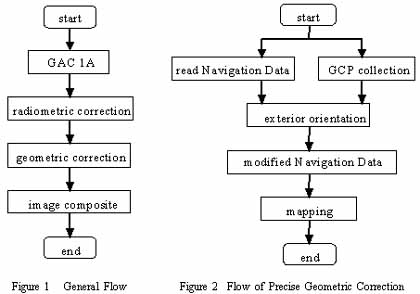
Figure 1 shows the general flow for image composite. The composite image consists of 10,000 pixels by 5,000 lines in Latitude/Longitude production. It contains scan geometry data like solar zenith and azimuth angle, satellite zenith and azimuth angle as well as channel data.
2.1 Radiometric Correction
The OCTS was operated with two kinds of gain mode as mentioned above. The radiometric correction had to be performed to match the pixel values from both modes onto the same radiometric level. The coefficients for the calibration were prepared through the NASDA's WWW site (NASDA, 2000).
2.2 Geometric Correction
The geometric correction with high accuracy is essential to generate composite images. The algorithm for precise geometric correction was developed. It was based on the collinearity equation in the photogrammetry (Hashimoto, T., 1997). The navigation data (satellite position and attitude) were treated as the orientation parameters, and they were adjusted utilizing GCPs.
First of all, the coordinates systems used here are defined as follows (see Figure 3);
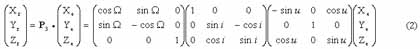
- (X,Y,Z): ECR(Earth Center Rotation) coordinates where the origin is the gravity center of the Earth, X axis is Greenwich Meridian at the equator, Z axis is North along the spin axis, Y is defined by right-handed rotation,
- (x, y, z): Orbital Coordinates where the origin is the gravity center of the satellite, z axis is nadir, y axis is defined by the outer product of z axis and velocity vector, x is defined by right-handed rotation.
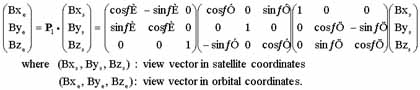

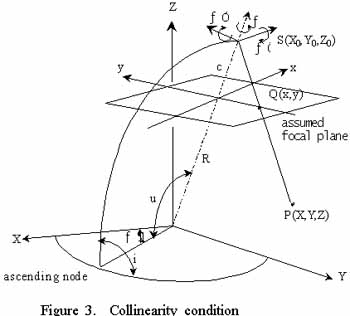
The view vector and the observed ground point (X, Y, Z) satisfy the collinearity equations as follows (Hashimoto, T., 1997).
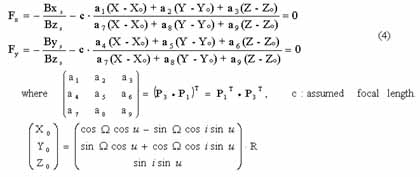
In the equation (4), the parameters (R, O, i, u) and (w, f, k ) are treated as exterior orientation parameters.
Sufficient numbers of GCPs are necessary for exterior orientation. Conventionally, the GCP has been collected by human interpretation. Such procedure is very time consuming and not proper for daily process. In this work, the GCP collection is realized automatically by the image matching technique. The matching was done using two kinds of templates; one from the Generic Mapping Tool (GMT) coastal data (Wessel, P., 1999) prepared in advance, another from the original image which was binarized to make coast line data. The position of templates was selected as a GCP candidate from the GCP library. The precise navigation data are determined using the GCPs. A rectified image is generated using the newly determined navigation data.
2.3 Image Composite
The composite process was carried out separately over land regions and ocean regions (see Figure 4). The land/ocean mask prepared in advance determined the separation of both regions. For the land, the MVC would be applied only if channel 7 (near infrared channel) was not saturated. Among the spectral channels of the OCTS data, channel 5 corresponds to the chlorophyll absorption channel (red color region). Generally, the plants containing chlorophyll have smaller reflectance than other ground cover or clouds. When the channel 7 was saturated, the process was carried out by selecting the pixels with the minimum value in channel 5.
Such a minimum value composite method by using channel 5 was also applied to the ocean regions. But, the method could not be applied to the Polar region, because some pixels were illuminated by small Solar radiation and had very small Digital Number (DN) owing to the big Solar zenith angle. To prevent such a case, one of the thermal infrared channels (channel 11) was used. While both the ice/snow and the cloud are cold, the cloud will be colder than the ice/snow. When the channel 7 was saturated in the Polar land region, the pixels with maximum value in channel 11 would be selected. In case that the channel 7 was not saturated, the pixels seem to be illuminated by small Solar radiation. The pixels observed at the minimum solar zenith angle was selected in such a case.
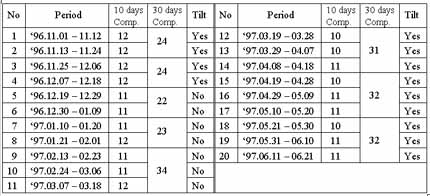
The period for image composite is very important for the analyses with use of them. If the period is too short, it will very difficult to extract cloud free pixels. On the other hands, if it is too long, the results will be less sensitive to the rapid changes of vegetation. Basically, the 10 days composite and the 30 days composite were adopted in this work. The OCTS was operational only about eight months after the initial checkout period. In three months of those 8 months, the OCTS was operated without the tilt function. All observed data were processed for the image composite. After all, 20 images for 10 days composite and 8 images for 30 days composite were generated as shown in Table 3.
3. Conclusions
- The system for the precise geometric correction of ADEOS/OCTS was developed. The algorithm of the geometric correction is based on the principle of collinearity condition.
- The new algorithm for generating a cloud free composite from OCTS data was developed. It was applicable to the saturated pixels in near infrared channels.
- 20 images for 10 days composite and 8 images for 30 days composite covering all observation period (8 months) were generated. It is very expected that these composite images will be used in some land environmental applications.
This work was partially supported by the 'GCMAPS program' conducted by Scientific Technology Agency of Japan.
References
- Hashimoto, T., 1997. Precise Geometric Correction of ADEOS/OCTS Imagery, Journal of JSPRS, Vol.36, No.5, pp.42-51
- Hashimoto, T., 1998. The Estimation of Motion and Attitude of ADEOS Satellite Utilizing the Principle of Exterior Orientation, Journal of JSPRS, Vol.37, No.6, pp.4-13
- NASDA, 2000, home page on ADEOS, on
http://www.eorc.nasda.go.jp/ - NOAA, 1997, NOAA GVI GUIDE, on
http://www2.ncdc.noaa.gov/docs/gviug/ - Wessel, P., 1999, GMT-The Generic Mapping Tools, on
http://www.soest.hawaii.edu/gmt
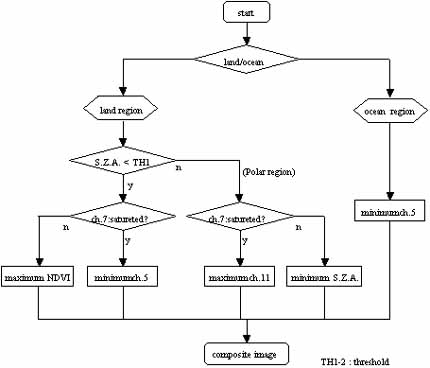
Figure 4 Selection of Pixel for Image Composite
Table 3 Composite images to be generated