| GISdevelopment.net ---> AARS ---> ACRS 2000 ---> Coastal Zone Monitoring |
Observing Intertidal Zones
Using Satellite Imagery
Rigel Hian Dee LEOW, Yihan
TAN, Chee Yuen WAN
Raffles Institution, Raffles Institution Lane
Singapore 575954,SINGAPORE
Christian MELSHEIMER
Centre for Remote Imaging, Sensing and Processing (CRISP)
Block S17, Level 2, Faculty of Science
National University of Singapore
Lower Kent Ridge Road
Singapore 119260
Tel.: (65)-8746587 Fax: (65)-7757717
E-mail: crscm@nus.edu.sg
SINGAPORE
Key Words: Intertidal Zone, SPOT, ERS
Abstract
The strip of land exposed at low tide and submerged at high tide is defined as the intertidal zone. We have studied the intertidal zone of the headland to the west of Rupat Island, Sumatra, using European Remote-Sensing Satellite (ERS) and Système Pour l'Observation de la Terre (SPOT) satellite images. The analysis of images of that area from the year 1996 to 2000 revealed a number of differences and changes that took place throughout that period of time. Most notable were the increase in vegetation on the coastline over time and development and growth of a new island from deposited sediments. Such observations can possibly be used to update maps.
1. Introduction
The intertidal zone is the coastal transition region between the permanently exposed land surface on one side and the submerged region on the other side. It is alternately exposed and submerged during each tidal cycle. The intertidal zone is subjected to ocean waves and tidal currents and hence can show rapid changes due to erosion and sedimentation. The aim of this paper is to monitor changes in intertidal zones using multitemporal satellite imagery. By comparing the intertidal zones delineated in the satellite images with those marked in existing maps, the accuracy of the existing maps can be assessed, and if necessary, the maps can be updated using information derived from the satellite imagery. Our test area is the intertidal zone around a headland near Rupat Island, on the eastern coast of the Riau Province in Sumatra, Indonesia (see Figure 1 and Figure 2). The intertidal zone here is relatively large in area and is easily visible in the high resolution SPOT and ERS SAR images. The images used were acquired by the SPOT satellites (SPOT=Satellite Pour l'Observation de la Terre) and by the ERS satellites (ERS=European Remote Sensing sattelite) within a four-year period from 1996 to 2000. Only images acquired near low-tides were used. Tidal levels as given in the figure captions were derived from tide tables (Hydrographer of the Navy, 1996,1997, 1998; Hyddrographic Branch, 1999, 2000). All the images were geometrically corrected and co-registered using prominent land features as ground control points.
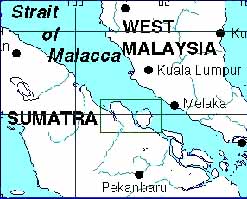
Figure 1: Map of the Straits of Malacca and the surrounding land masses. The arrow marks the location of the area studied.
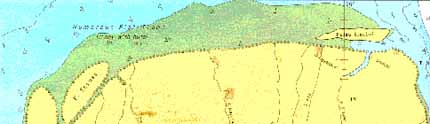
Figure 2: Map of the studied area (adapted from: Hydrographer of the Navy, 1998, Admiralty Charts) on the east coast of Sumatra, Indonesia. Green represents intertidal zone at tide level 0.0 m while yellow represents land.
2. Spot And Ers Images
The satellites ERS-1 and ERS-2 (Kramer 1996) of the European Space Agency (ESA) orbit the earth at an altitude of 780 km and among other sensors carry a synthetic aperture radar (SAR). The SAR operates at a frequency of 5.3 GHz (C-band microwaves) and has a ground resolution of 25 m. It measures the intensity of the microwaves that are backscattered from the ground. This backscatter intensity depends strongly on the roughness of the ground surface: The rougher the surface, the stronger the backscatter intensity, and the brighter the SAR image. The SPOT satellites (Kramer 1996) of the Centre National d'Etudes Spatiales (CNES) orbit the earth at an altitude of 832 km and each carry two High Resolution Visible scanners (HRV). The HRV collects radiance data in optical and near-infrared wavelengths, either in a broad-band (panchromatic) mode with a ground resolution of 10 m, or in a three-band (multispectral) mode with a ground resolution of 20 m. Here we only consider images taken in multispectral mode. The three spectral bands are 500-590 nm (band 1, roughly: green visible light), 610-680 nm (band 2, roughly: red visible light), and 790-890 nm (band 3, near infrared). We use the common way of displaying the multispectral images as RGB images with band 3 as R, band 2 as G and band 1 as B. Since plants strongly reflect NIR light, vegetation looks red in the images. In contrast, the sea, which absorbs NIR light almost totally, appears in hues of blue and green.
3. Observations And Discussion
3.1 ERS SAR and SPOT HRV Images of the Intertidal Zone
The intertidal zone in the studied area consists of sand and mud deposits. The landward portion may be covered by mangrove vegetation while the remaining portion is bare (tidal sand and mud flats). In ERS SAR images (e.g Figure 3), the part of the intertidal zone that is not covered by vegetation (i.e. the tidal flats) looks very dark as it consists of mud and sand and therefore has a smooth surface. In contrast, areas covered by vegetation and wind-roughened water surfaces have significantly higher radar backscatter and appear brighter in ERS SAR images. Under very low wind or calm conditions, the water surface appears very dark and cannot be easily distinguished from sand and mud flats.
Note that branched bright lines are visible in some areas (see Figure 7 and Figure 6). They mark channels and creeks that drain the intertidal zone when the tide is going down. The current creates roughness (ripples) on the sand and mud, thereby increasing the radar backscatter.
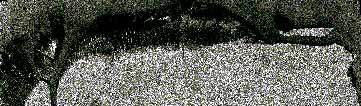
Figure 3: ERS SAR image, 15 Apr 1996, 22:56:10 GMT, Tide Level 0.81m(0.5h after low tide). Image Size 57 km x 18 km (© ESA 1996)
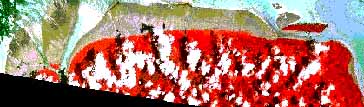
Figure 4: SPOT image, 7 Oct 1999, 04:04:45 GMT, Tide Level 0.85m (1h after low tide). Image Size 57km x 18km (© CNES 1999)
In SPOT HRV images, the part of the intertidal zone that is not covered by vegetation (i.e. the tidal flats) appears in shades of greyish brown (see Figure 4). The seaward edge of the intertidal zone is very distinct whenever sun glitter causes the sea to appear brighter. In other cases, the edge may be less distinct. A zoom into the SPOT image (see Figure 5) shows that the tidal flat area has two distinct parts of different colours, light grey and dark grey. The part of the intertidal zone nearer the land is mostly light grey, while the part of the intertidal zone near the sea is mostly dark grey. This happens because the soil nearer the land has been exposed to the air for a longer time, so it is drier and looks lighter than the wet part. Another factor could be that different types and grainsizes of sediments are deposited at different zones.
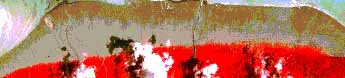
Figure 5: SPOT image (subset from Figure 4 ), 7 Oct 1999, 04:04:45 GMT, Tide Level 0.85m (1h after low tide) Image Size 20 km x 5 km (© CNES 1999) Note that the landward part of the intertidal zone, when covered by mangrove vegetation, cannot be easily distinguished from vegetation on dry land, neither on ERS SAR nor on SPOT HRV images. Thus what seems to be the landward edge of the intertidal zone is actually the seaward edge of the mangrove vegetation.
3.2 Difference in the Shape of the Intertidal Zone
Comparing Figure 7 and Figure 6, there appears to be a change in shape of the intertidal zone. The intertidal zone in the 1996 image (Figure 7) has a smooth seaward edge. In the image taken in 2000 (Figure 6), however, the seaward edge of the intertidal zone is jagged and irregular. A possible cause is a difference in water level in connection with the topography of the intertidal zone. After low water, the lower regions such as channels and creeks get flooded first, resulting in the irregular shape at intermediate tide levels. Another possible cause is that during the 4 years of time difference, waves, currents and sedimentation have actually modified the shape of the intertidal zone.
3.3. Extension of Vegetation Along the Northern Coast Over Time
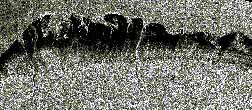
Figure 6: ERS SAR image, 20 Jan 2000, 10:37:51 GMT, Tide Level 0.13m, (10 min before low tide) Image Size 18 km x 4.5 km (© ESA 2000)

Figure 7: ERS SAR image, 15 Apr 1996, 22:56:10 GMT, Tide Level 0.81m (0.5h after low tide) Image Size 18 km x 4.5 km (© ESA 1996)
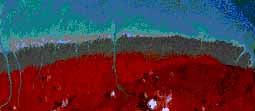
Figure 8: SPOT image, 20 Apr 1999, 04:01:46 GMT, Tide Level 2.55m (3h before low tide) Image Size 11 km x 4.8 km (© CNES 1999)
In the SPOT image in Figure 8 (from 1999), the boundary of the vegetation (mangrove) along the coast is clearly visible as the line where the red portion (vegetation) meets the brownish-grey (tidal flats). In the ERS SAR image in Figure 6 (from 2000), there is a slightly curved and distinct line along the northern coast, separating lighter grey (below) from darker grey (above). It roughly coincides with the vegetation boundary found in the above-mentioned SPOT image (Figure 8). Note that the water level at the acquisition time of this SPOT image was quite high (3 hours before low tide). Therefore the stretch of tidal flats visible on that image is much narrower here than in the ERS SAR images (Figure 7 and 7). The vegetation boundary in the image in Figure 7 (from 1996) has a different shape, it is slightly concave. Comparison with the ERS SAR image in Figure 6 (from 2000) shows that the vegetation (probably mangrove) has actually extended seaward within the 4 years.
3.4. Formation of New Island with Vegetation

Figure 9: SPOT image, 19 Jul 1996, 03:55:14 GMT, Tide Level 1.68m (2h before low tide) Image Size 5 km x 6 km (© CNES 1996) There seems to be a new island forming between two already existing islands, Pulau Serusa and Pulau Berkey, near the estuary of the Rokan river at the western end of the studied area. According to images taken of that area from 1996 to 1999, what was an offshore intertidal zone in 1996 (see Figure 9) has slowly become a small island in 1999 (see Figure 10).
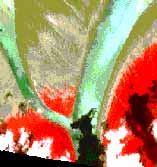
Figure 10: SPOT image (subset from Figure 4), 7 Oct 1999, 04:04:45 GMT, Tide Level 0.85m (1h after low tide) Image Size 5 km x 6 km (© CNES 1999)
There are to possible causes: Either (1) the deposition of sediments has increased over the years, possibly because of human activity, e.g. deforestation and land clearing upstream, or (2) the erosion has decreased. As the area is silted, vegetation grows on the intertidal zone and consolidates is until it becomes stable and eventually permanently emerges from the water.
3.5. Absence of Intertidal Zone East of Sinaboi Island
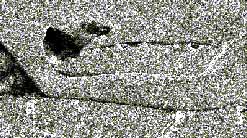
Figure 11: ERS SAR image, 20 January 2000, 03:37:51 GMT, Tide Level 0.13m (10min before low tide) Image Size 5 km x 3 km (© ESA 2000)
The SPOT image in Figure 11 shows that a wide intertidal zone only occurs along the seaward side of the western tip of the island Pulau Sinaboi. This suggests that the eastern part of the island is apparently more sheltered from the strong currents in the Straits of Malacca than the western part. Furthermore, the image suggests that apparently there is a strong current in the channel between the island, with the main current direction going towards the west: Whereas there are no significant tidal flats at the banks of that channel, there are extensive tidal flats beyond the western opening of the channel (where the current spreads out and loses its energy). Note also that the extent and shape of the intertidal zone on the map (Figure 2) does not correspond with the extent and shape of the intertidal zone on the image (Figure 11)
4. Summary And Conclusions
This study has shown that ERS SAR as well as SPOT HRV multispectral images can be used for observing intertidal flats. SPOT HRV multispectral images have the advantage of clearly showing vegetation, whereas ERS SAR images have the advantage of not being affected by cloud cover, as the microwaves penetrate clouds. Several changes in the intertidal zone of the study area were observed to have taken place during the four-year period. In one area, the vegetation (probably mangroves) along the coast has extended its boundary towards the sea. In another area, the low-tide coastline has changed its shape from smooth to jagged and irregular. A new island with vegetation growth has been observed to form between two existing islands. By comparing the intertidal zones delineated in the satellite images with those marked in existing maps, the accuracy of the existing maps can be assessed and if necessary, the maps can be updated using information derived from the satellite imagery.
Acknowledgments
The first three authors of this paper (R. H. D. Leow, Y. Tan, and C. Y. Wan) are secondary school students at the Raffles Institution, Singapore. This study was performed while they were attached to CRISP, under the supervision of C. Melsheimer, in the framework of the Science Mentorship Program of the Gifted Education Branch, Ministry of Education, Singapore.
References
Hydrographer of the Navy 1998. Chart of Malacca Strait - Port Klang to Melaka y(Fifth Edition). Admiralty Charts and Publications 1998.
Hydrographer of the Navy 1996, 1997, 1998. Admiralty Tide Tables Atlantic and Indian lOceans 1996, 1997, 1998 (Volume 2).
Hydrographic Branch, Royal Malaysian Navy 1999, 2000. Tide Tables Malaysia 1999, 2000 (Volume 1).
Kramer, H.J., 1996. Observation of the Earth and Its Environment - Survey of Missions and Sensors (Third Enlarged Edition). Springer-Verlag Berlin Heidelberg, Germany.