| GISdevelopment.net ---> AARS ---> ACRS 2000 ---> Coastal Zone Monitoring |
* : College of Agriculture, University of the Ryukyus,
Senbaru 1, Nishihara, Okinawa 903-0129, Japan
Tel.81-98-895-8792, Fax. 81-98-895-8734
E-mail: sato4408@agr.u-ryukyu.ac.jp
** : Air-Graph Co. Ltd., Kamiigusa 1749-1, Kawashima,
Hiki, Saitama 350-0152, Japan
Tel. 81-492-97-7410, Fax. 81-492-97-7414
E-mail:aan01610@nyc.odn.ne.jp
Key Words: Mangrove forest, Sub-compartments, Stand parameters, Quantitative information
Abstract
We have investigated the application of remote sensing for management and control of mangrove forest. In the process, a mask procedure had been suggested to separate whole area into three large categories of land area, mangrove forest and waters. It was effective to avoid misclassification occurred among three categories in case of whole scene classification, and it was also necessary for estimation of mangrove stand parameters with the regression equations among them and satellite data. A qualitative and quantitative two-ply expression had been tried, for example it was overlaid print of black mark corresponding species on colored map corresponding classified estimated growing stock. In this paper, we tried to sum up total growing stock in each sub-compartment and to extract properties for the quantitative stand structure of them by overlaying masks on two Okinawan mangrove forests. Such information should be useful for sustainable management and control of mangrove forest.
1. Introduction
We have investigated the application of remote sensing for management and control of mangrove forest that has difficult conditions for field survey. In the process, a mask procedure had been suggested to separate whole area into three large categories of land area, mangrove forest and waters (Sato K. et al., 1997). The intents were to avoid misclassification occurred among the categories in case of whole scene classification, and to estimate quantitative information of mangrove forest based on correlation and regression analysis between satellite data and stand parameters of it. It was succeeded to extract only mangrove forest from the whole scene by the mask procedure. The correlation and regression analysis were done among remote sensing data and stand parameters obtained from complete enumeration at 14 sample plots in southern Okinawa. Remote sensing data were TM data of Landsat 5 and indexes calculated as combination with data of bands (Dwi S. et al., 1997a, 1997b). Digital value of band 4, indexes of B1/B4, B4/(B3+B2), (B4-B3)/(B4+B3) and so on showed significantly high correlation coefficients with some stand parameters of mean DBH(diameter at breast height), mean tree height, mean crown size and growing stock and so on. The mask procedure was effective for the estimation of stand parameters by substitution of remote sensing data in the regression equations. As it became possible to make a data set to correspond only mangrove forest, we tried to apply this way to two mangrove forests in Okinawa, and it was effective to show multiply distribution of species and resources of mangrove (Kanetomi M. et al., 1998). By this way, it becomes possible to sum up the amount of resources particularly with species or mixture ratio of mangrove forest. This matter increases the usefulness of remote sensing for sustainable management and control of mangrove forest. Generally the forest is controlled as compartments sectionalized according to topography and a compartment is controlled as sub-compartments according to forest type, site productivity, forest land use and land parcel. In this paper, some trials were described as a case study that were each particular sum of the amount of resources with main tree species or mixture ratio in each sub-compartment and sum of them as whole mangrove forest, and expression as figures of frequency distribution of tree height and DBH for each sub-compartment. Two mangrove forests examined here are located in southern Okinawa. The boundaries were not actual, they were assumed and drawn by the authors for this case study. By this examination, it became clear that this way was useful to grasp quantitative information and properties of stand structure for each sub-compartment of mangrove forest.
2. Data and method
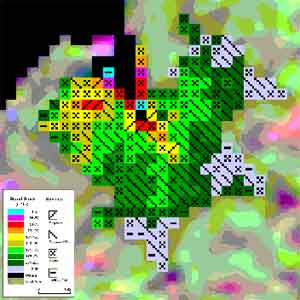
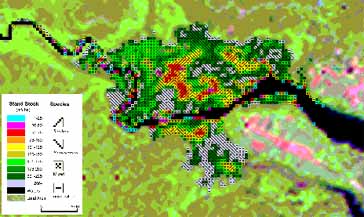
Data used in this paper was same with the data in a series of our examination to apply remote sensing for mangrove forest. Satellite data was TM data of Landsat 5 accumulated May 16th, 1994 and stand parameters were obtained from complete enumeration at 14 sample plots in Ishigaki Is and Iriomote Is., 11 points in May 1995 and 3 points in February 1996. All digital values of band 4 in the data set corresponded to only mangrove forest produced through the mask procedure, were substituted in the regression equation of Y=6.18X-354.2 (r=0.878) between data of band 4 and growing stock. The distribution of main mangrove species and mixed stand by maximum likelihood method was overlaid on the distribution map of estimated growing stock with the above equation as a multiple expression. Quoted and arranged two multiple maps were shown as Figure 1. Assumed and drawn boundaries were overlaid on the imagery of band 4 and pixels inside a sub-compartment were painted with black or given zero by the reference of the boundaries. Outside pixels were painted white or given 255. By this way, masks were separately made for each sub-compartment. A data set of a sub-compartment was obtained by addition of this mask and data of band 4. Although stand parameters can be estimated with some indexes combined bands, in this paper digital value of band 4 was substituted in regression equations for estimation of growing stock, mean of DBH and tree height. The regression equations were shown with the correlation coefficient in Table 1. In forestry, growing stock of every small stand is expressed as trunk volume per hectare for the convenience of comparison among many stands. Here, growing stock of 1 pixel area was calculated from estimated value multiplied by 9/100 for conversion from per 10000m2 to per 900m2.
| Stand parameter as Y | Regression equation | Correlation | Unit for one pixel |
| Coefficient | |||
| Growing stock Mean DBH Mean tree height |
Y=6.18X-354.2 Y=0.1137exp(0.0532X) Y=0.264X-15.4 |
0.878 0.954 0.958 |
(9/100)m3 cm m |
Remarks Y : stand parameter, X : digital value of band 4, correlation coefficient : significant at 0.1% level(>0.78)
Table 1. Regression equations used in this examination
3. Results and discussion
It was easy to make black pixels as the mask for each sub-compartment by utilization of suitable application software for painting, smearing and drawing after overlay sub-compartment map to an imagery of remote sensing data. Although this procedure was done by hand works here, it was considered that program was not so complicate to make the mask automatically. The procedure to make masks and masks for 4 sub-compartments of mangrove forest in the mouth of Fukido-gawa River, were shown in Figure 2. The data sets were obtained by overlaying each
|
Location |
Sub-compartment |
Growing stock (m3) |
Area (ha) | ||||
|
R. s. |
B. g. |
mixed |
uncl. |
total | |||
|
Nakama-gawaRiver(Iriomote Is.) |
1 2 3 4 5 6 |
220.7 555.8 18.4 105.8 170.8 14.3 |
4,473.9 2,399.2 1,260.7 1,030.6 3,177.5 52.3 |
3,810.8 1,983.6 3,254.6 1,537.8 2,597.4 683.0 |
253.2 0.0 276.2 374.7 594.9 0.0 |
8,758.6 4,938.6 4,809.9 3,048.9 6,540.5 749.6 |
47.52 33.21 27.00 18.72 34.02 4.95 |
|
total |
|
1,085.8 |
12,394.2 |
13,867.2 |
1,499.0 |
28,846.1 |
165.42 |
|
Fukido-gawaRiver (Ishigaki Is.) |
1 2 3 4 |
38.2 5.4 9.3 11.0 |
219.9 537.3 855.4 174.2 |
481.0 481.4 427.6 524.5 |
49.4 122.4 69.0 0.0 |
788.4 1,146.5 1,361.2 709.6 |
5.58 5.94 6.48 4.05 |
|
total |
|
63.9 |
1,786.8 |
1,914.5 |
240.8 |
4,005.7 |
22.05 |
Remarks R. s.: stand with dominant species of Rhizophora stylosa, B. g.: stand with main species of Bruguiera gymnorrhiza, mixed : mixed stand with R. stylosa and B. gymnorrhiza, uncl. : unclassified stand
Table 2. Sum of growing stock of two species and mixed stand in each sub-compartment and whole forest for two mangrove forests in Okinawa
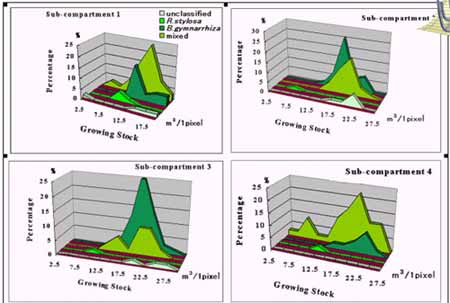
Figure 3. Frequency distribution figures for growing stock in each pixel ( Fukido-gawa R. )
mask on remote sensing data. The all data were substituted in the regression equation for growing stock in serial order, and the estimated values were separated with classified main species or mixed stand and summed up separately. For mean of DBH and tree height, same data were substituted in each regression equation in like manner and frequency distribution figures
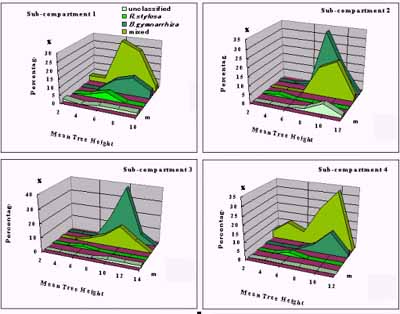
Figure 4. Frequency distribution figures for mean tree height in each pixel ( ditto )
were drawn by arrangement of estimated values. The results were shown as Table 2 and Figure 3. Figures for DBH were omitted, as the tendency was similar with the figures for mean tree height in each pixel. Although the detail in Table 2, Figure 3 and 4 were not investigated from the point of forestry view, the information in them should be useful for management and control of mangrove forest.
4. Conclusion Results mentioned above clearly showed usefulness of remote sensing for management and control of mangrove forest. Significant high correlation between data of band 4 and growing stock as total of trunk volume suggests possibility of that the amount of absorbed and fixed carbon dioxide also can be estimated by remote sensing. Because it should be converted from the amount of biomass as the total of all parts mangrove estimated by remote sensing data.
References
Dwi S. , Sato K. & Kohda Y. : 1997a, Relationships Between TM Data of Landsat 5 and Stand Parameters on Mangrove Forest in Okinawa, Jour. of Japan Soci. of Photog. and RS, 36 (2), pp.4-12
Dwi S. , Sato K & Kohda Y. : 1997b, Relationships Between Calculated Indexes from TM Data of Landsat 5 and Stand Parameters on Mangrove Forest in Okinawa, Jour. of Japan Soci.of Photog.and RS, 36 (3), pp.6-12
Kanetomi M. , Sato K. & Yamauchi T. : 1998, Expression of Qualitative and Quantitative Information on Mangrove Forest in Okinawa, Proceedings of the 19th Asian Conference on Remote Sensing, Q-13-1-6
Sato K. , Nakajima M. & Hoshi T. : 1997, Conception Qualitative and Quantitative Classification of Mangrove Forest with TM Data of Landsat 5, Proceedings of the 18th Asian Conference on Remote Sensing, G-6-1-6